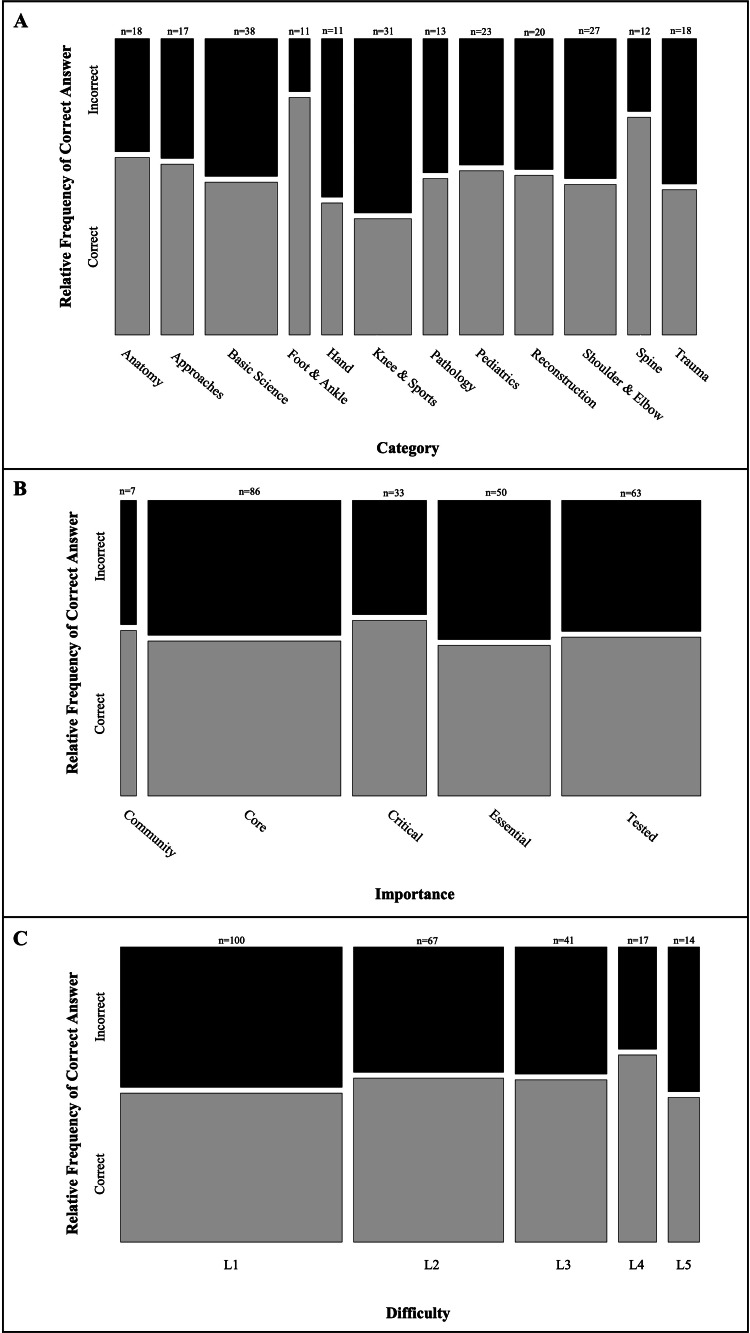
Figure 1. ChatGPT correct vs. incorrect answers by question characteristics.
Figures represent the relative frequency of ChatGPT correct (gray) vs. incorrect (black) responses by (A) question category, (B) importance, and (C) difficulty. Column height by color represents the relative frequency of correct vs. incorrect answers and column width represents the relative sample size by category. All data were collected from the Orthobullets dataset (n = 239).

