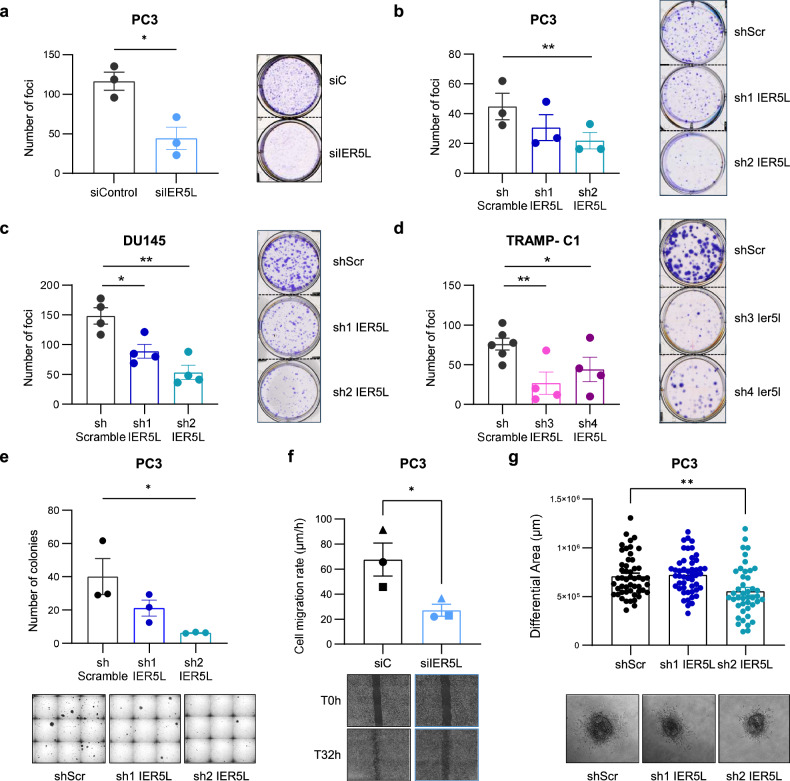
Fig. 2. IER5L depletion reduces growth under stress, migration and invasion of prostate cancer cells.
a Foci-formation analysis of PC3 cells transfected with the indicated siRNA. The number of foci is shown (left panels). Representative images are shown (right panels). A t-test was applied for statistical analysis (n = 3). siC: non-target siRNA. b–d Analysis of foci formation upon IER5L depletion with the indicated shRNAs. The number of foci is shown (left panels). Representative images are shown (right panels). A paired t-test was applied for statistical analysis (b n = 3; c, d n = 4). shScr: shScramble. e Analysis of anchorage-independent growth of PC3 cells transduced with the indicated shRNAs. The number of colonies is shown (left panel). Representative images are shown (right panel). A paired t-test was applied for statistical analysis (n = 3). f Cell migration rate of PC3 cells transfected with the indicated pool of siRNAs. The different biological replicates are indicated with unique dot shapes (top panel). Representative images of the scratch at time (T) 0 and 32 hours (h) are shown (bottom panel). Two days after siRNA transfection were defined as the initial timepoint for the assay. A two-tailed paired t-test was applied for statistical analysis (n = 3). g Quantification of the invasive growth of PC3 cells embedded in collagen. The diameter of the spheroids was measured at 0 and 72-h and the differential area was calculated (top panel). Representative images of the spheroids at final timepoint are shown (bottom panel). A two-tailed unpaired t-test was applied for statistical analysis (n = 4).

