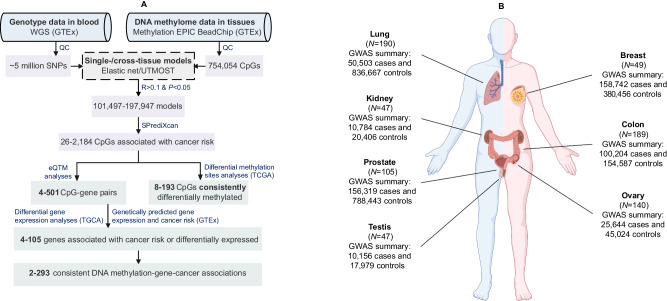
Fig. 1. Overall workflow and resources of the present study.
A the overall workflow. The range of values denotes the minimum and maximum numbers across all tissue or cancer types. WGS whole genome sequencing, GTEx Gene-Tissue Expression consortium, QC quality control, UTMOST Unified Test for MOlecular SignaTures, eQTM expression quantitative trait methylation, TCGA The Cancer Genome Atlas. B tissue samples used in DNA methylation prediction model development and cancer GWAS data used in association analyses. N number of samples, GWAS genome-wide association studies. The (B) was created with BioRender.com released under a Creative Commons Attribution-NonCommercial-NoDerivs 4.0 International license.

