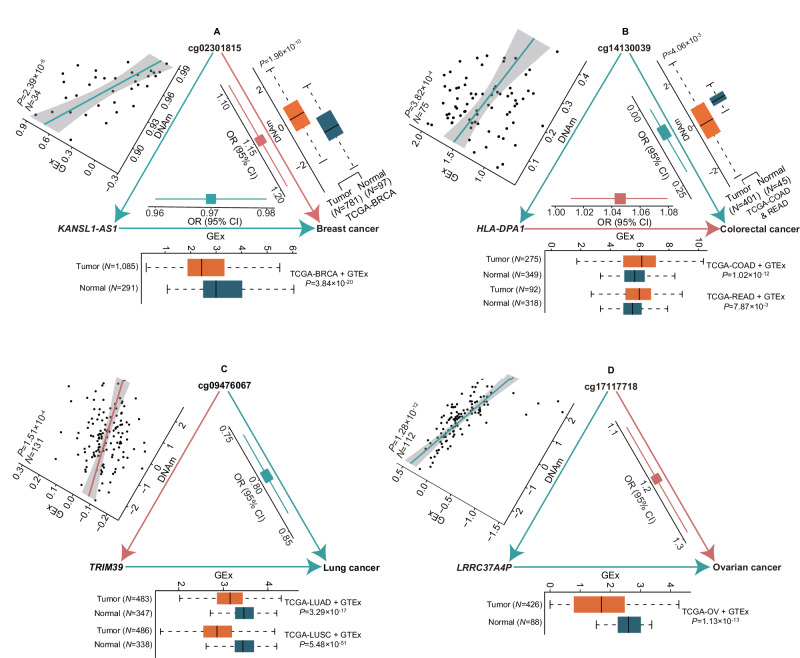
Fig. 3. Examples of CpG-gene-cancer trios suggesting DNA methylation influencing cancer risk by modulating cis-gene expression.
Association analyses of genetically predicted DNA methylation (DNAm) or gene expression (GEx) with cancer risk were performed using SPrediXcan. Differential DNAm or GEx analyses were conducted using linear mixed models. Association analyses between DNAm and GEx were performed using linear regression. Red arrows, lines, and blocks denote positive associations, while green ones denote negative associations. All statistical tests were two-sided and multiple comparisons were Bonferroni- or false discovery rate (FDR)-adjusted. The odds ratio (OR) and 95% confidence interval (CI) for cancer risk per standard deviation (SD) increase in genetically predicted DNAm or GEx are displayed as a block with error bands. In boxplots, boxes represent the interquartile range, black bars are medians, and whiskers extend at most 1.5 times the interquartile range. In the scatter plot displaying the association between DNAm and GEx, directly measured DNAm and GEx values after quantile- and inverse-normalization are presented. N number of samples, TCGA The Cancer Genome Atlas, GTEx Gene-Tissue Expression consortium, BRCA breast invasive carcinoma, COAD colon adenocarcinoma, READ rectum adenocarcinoma, LUAD lung adenocarcinoma, LUSC lung squamous cell carcinoma, OV ovarian serous cystadenocarcinoma. A DNAm at cg02301815 may elevate breast cancer risk by suppressing the expression of KANSL1-AS1. The sample size was 878 for tumor-normal differential DNAm analyses, 34 for DNAm-GEx correlation analyses, 1376 for tumor-normal differential GEx analyses, and 539,198 for association analyses of predicted DNAm and GEx with breast cancer risk, respectively. B DNAm at cg14130039 may decrease colorectal cancer risk by suppressing the expression of HLA-DPA1. The sample size was 446 for tumor-normal differential DNAm analyses, 75 for DNAm-GEx correlation analyses, 624 (TCGA-COAD + GTEx) and 410 (TCGA-READ + GTEx) for tumor-normal differential GEx analyses, and 254,791 for association analyses of predicted DNAm and GEx with colorectal cancer risk, respectively. C DNAm at cg09476067 may decrease lung cancer risk by promoting the expression of TRIM39. The sample size was 131 for DNAm-GEx correlation analyses, 830 (TCGA-LUAD + GTEx) and 824 (TCGA-LUSC + GTEx) for tumor-normal differential GEx analyses, and 887,170 for association analyses of predicted DNAm and GEx with lung cancer risk, respectively. D DNAm at cg17117718 may increase ovarian cancer risk by suppressing the expression of LRCC37A4P. The sample size was 112 for DNAm-GEx correlation analyses, 514 (TCGA-OV + GTEx) for tumor-normal differential GEx analyses, and 70,668 for association analyses of predicted DNAm and GEx with ovarian cancer risk, respectively. Differential DNAm analyses were unable to be performed for ovarian cancer-associated CpG because of the small sample size (n < 10) of the TCGA-OV DNA methylation datasets. Source data are provided as a Source data file.

