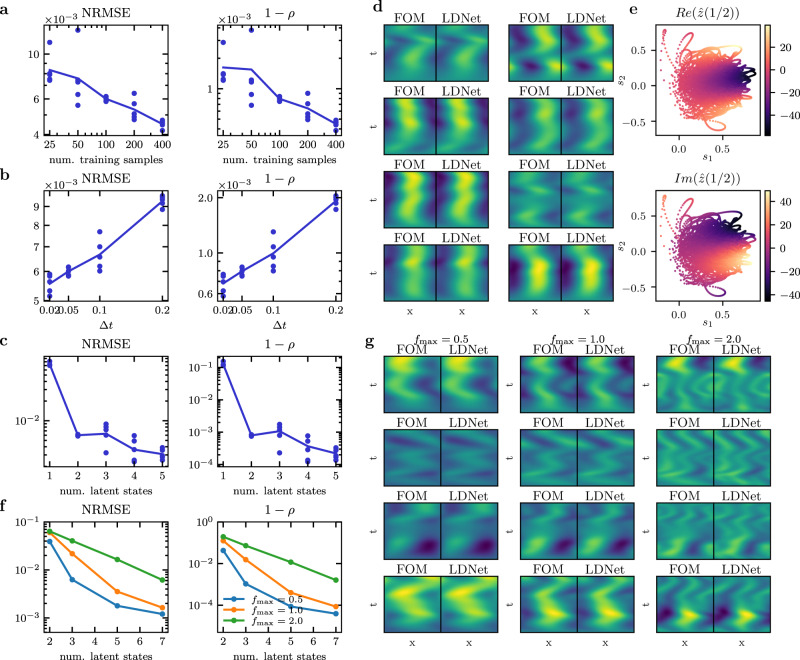
Fig. 2. Results of Test Case 1.
a–c Testing accuracy of Test Case 1b, as a function of the number of training samples (with Δt = 0.05 and 2 latent variables), of Δt (with 100 training samples and 2 latent variables), and of the number of latent variables (with Δt = 0.05 and 100 training samples). For each setting we perform 5 training runs with random weights initialization. Each dot corresponds to a training run, while the solid line is the geometric mean. d FOM against LDNet predictions on 8 testing samples for Test Case 1b. The abscissa corresponds to space and the ordinate to time. e Mapping from the latent space trajectories and the Fourier space coefficients of the FOM solution for the testing samples of Test Case 1b. f Testing accuracy of Test Case 1c as a function of the number of latent states and of the maximum input frequency . g FOM against LDNet predictions on 4 testing samples for Test Case 1c, obtained by employing 5 latent states, for different maximum input frequencies (reported above the figure).

