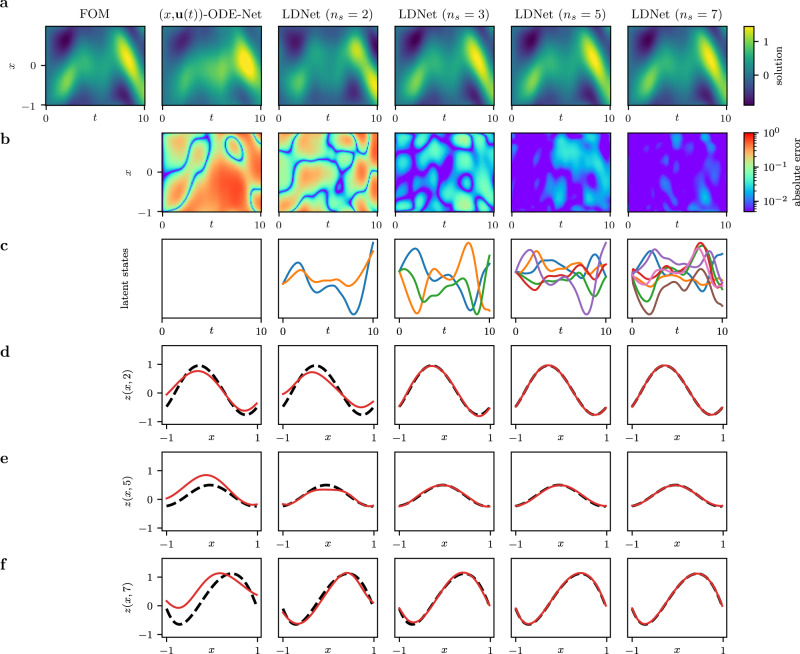
Fig. 3. Test Case 1c: impact of latent states.
We compare, for a sample belonging to the test dataset, the results obtained by using LDNets with increasing number of latent states (2, 3, 5, 7) and by using an ODE-Net fed by the input signal and the query point (denoted by (x, u(t))-ODE-Net). The left-most column reports the FOM solution (the abscissa denotes time, the ordinate denotes space). For each method we report: a the space-time solution; b the space-time error with respect to the FOM solution; c the time-evolution of the latent variables; d–f three snapshots of the space-dependent output field at t = 2, 5 and 7, in which we compare the predicted solution (red solid line) with the FOM solution (black dashed line).

