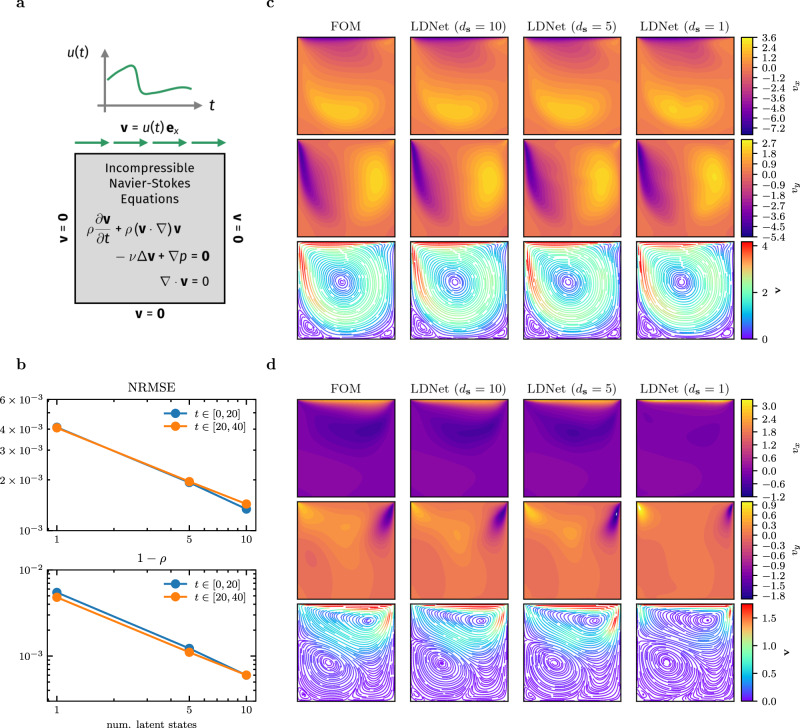
Fig. 4. Test Case 2.
a Computational domain and equations of the FOM. b Error metrics (NRMSE and Pearson dissimilarity) of LDNets for different number of latent variables (ds = 1, 5 and 10). The training dataset consists of 80 simulations with T = 20, while the test dataset comprises 200 simulations with T = 40. The blue lines refer to the test error obtained in the interval t ∈ [0, 20] (that is the same interval seen during training), while orange lines refer to the test error in the interval t ∈ [0, 40]. c A snapshot of the velocity field within the interval t ∈ [0, 20] (interpolation interval) of a testing sample. d A snapshot of the velocity field within the interval t ∈ [20, 40] (extrapolation interval) of a testing sample. For an animated version of this figure, see Supplementary Movies 1–10.

