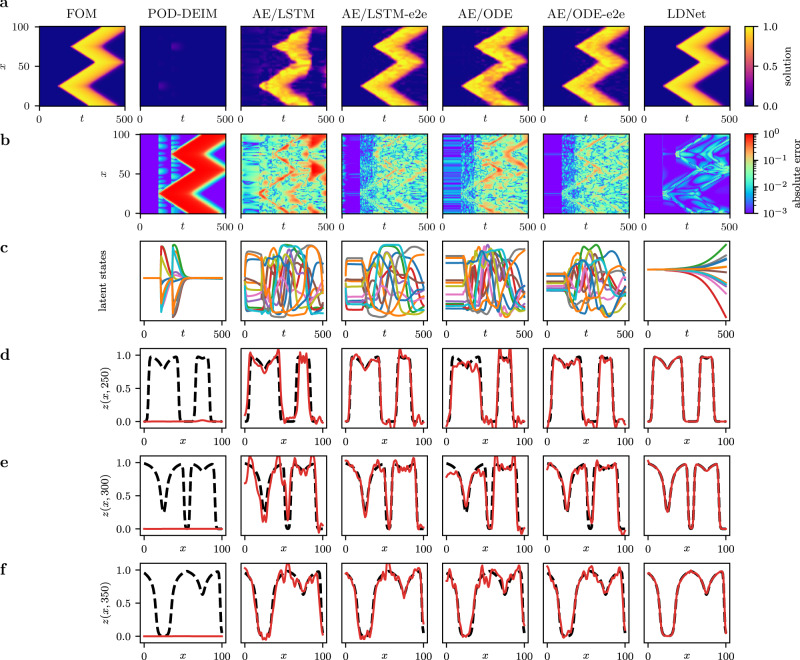
Fig. 5. Test Case 3: methods comparison.
We compare the results obtained with different methods for a sample belonging to the test dataset. The left-most column reports the FOM solution of the AP model (the abscissa denotes time, the ordinate denotes space). For each method we report: a the space-time solution; b the space-time error with respect to the FOM solution; c the time-evolution of the 12 latent variables; d–f three snapshots of the space-dependent output field at t = 250, 300 and 350, in which we compare the predicted solution (red solid line) with the FOM solution (black dashed line). For an animated version of this figure, see Supplementary Movies 11–20.

