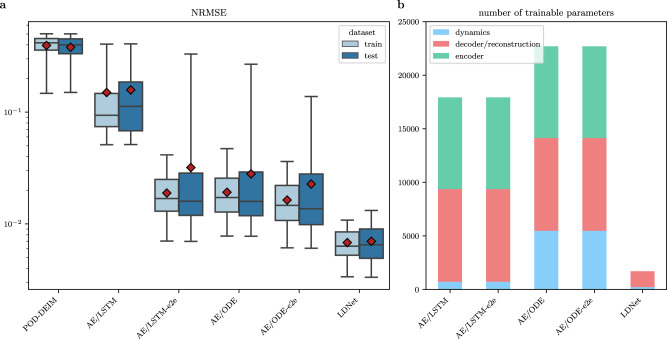
Fig. 6. Results of Test Case 3.
a Boxplots of the distribution of the testing (blue) and training (light blue) errors obtained with each method. The boxes show the quartiles while the whiskers extend to show the rest of the distribution. The red diamonds represent the average error on each dataset. b Number of trainable parameters of each method. The bin encoder is present only for auto-encoder-based methods, but not for LDNets. The bin dynamics refers to the NN that evolves the latent states. The POD-DEIM method is not included, as it does not envisage a training stage.

