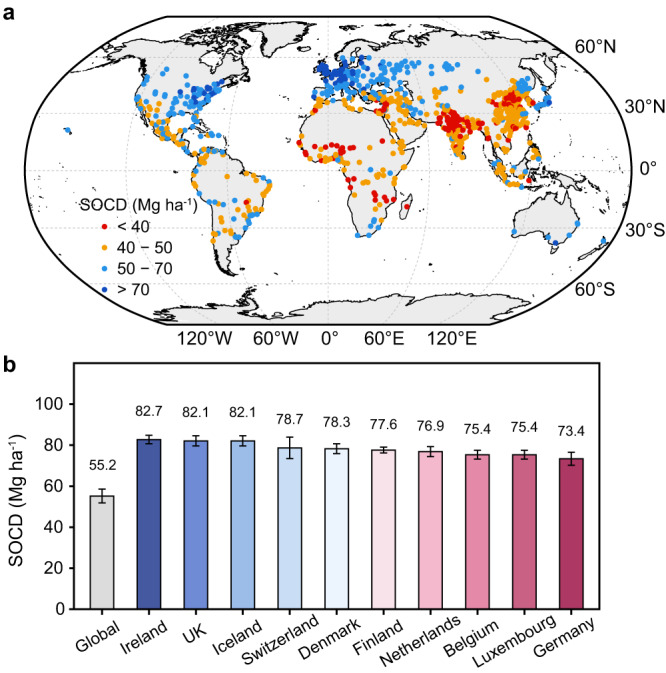
Fig. 3. Global patterns of predicted surface SOC density (SOCD) (0–20 cm) and area-weighted national mean SOCD in urban greenspaces.

a Predicted SOCD of urban greenspaces for mid- and large cities (urban population > 0.5 million) (Supplementary data 1). b Average SOCD of urban greenspaces estimated for the globe and top ten countries weighted by areas. The colour of circle in Fig. 3a indicate variations in predicted SOCD. Error bars in Fig. 3b represent the 95% confidence intervals.
