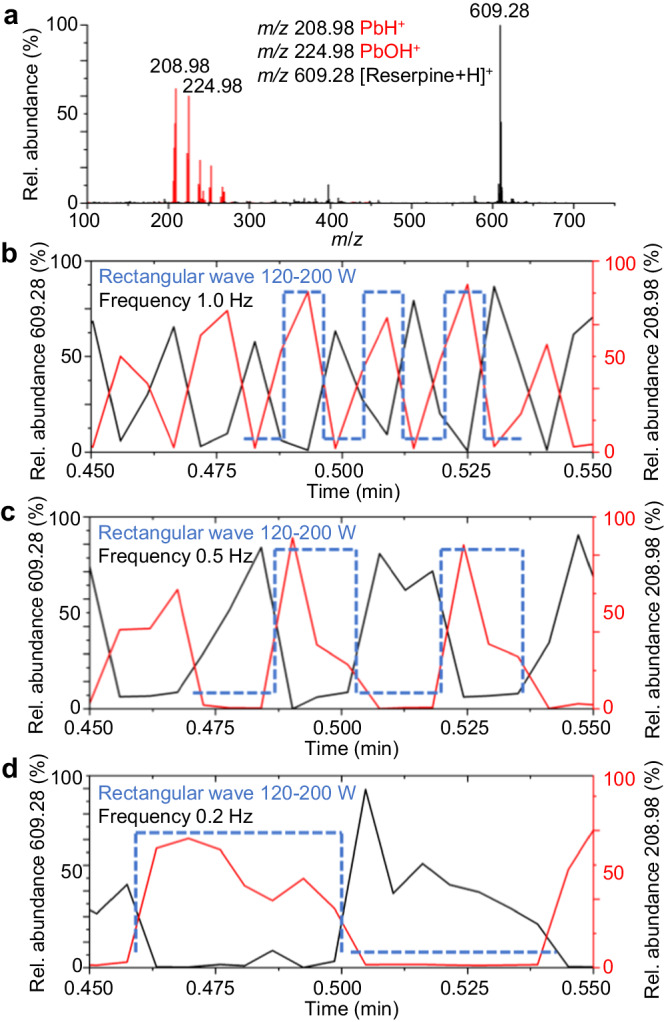
Fig. 2. Mass spectra and extracted-ion chromatography (EIC) plots of reserpine and divalent lead when ionized with different scanning waveforms (120–200 W, blue line).

a Mass spectra of divalent lead ions (red) and reserpine ions (black) detected simultaneously under rectangular wave scanning. EIC plots for both ions when rectangular wave at (b) 1.0, (c) 0.5, and (d) 0.2 Hz was applied, the red line represents the EIC plot of divalent lead ions, and the black line is the EIC plot of reserpine, the blue dashed line represents the applied rectangular wave timing.
