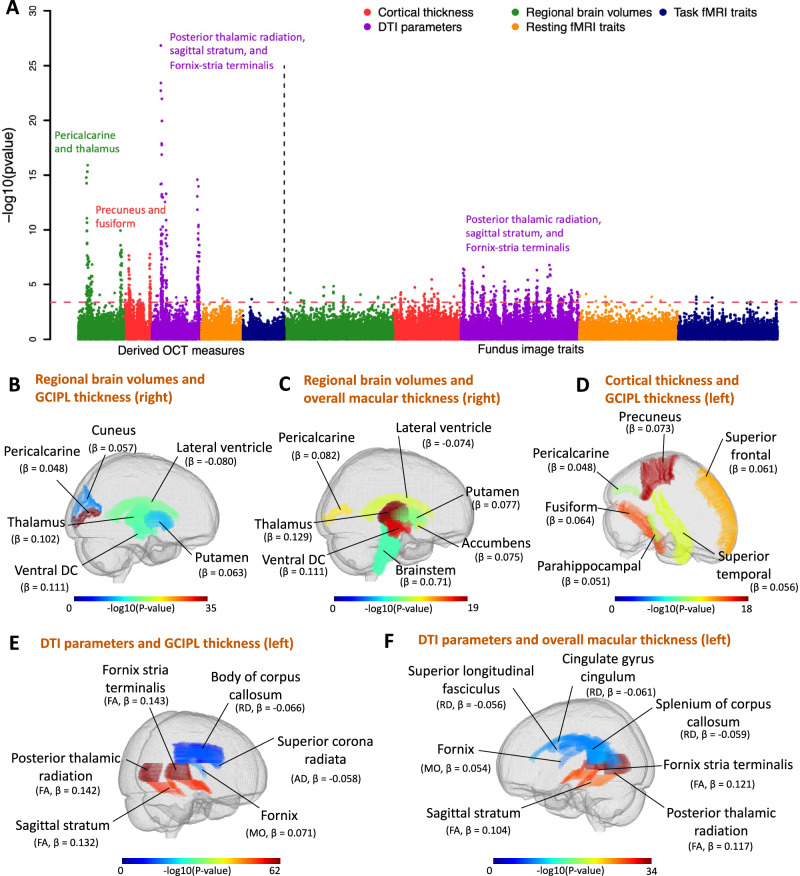
Fig. 2. Phenotypic eye-brain imaging associations.
A This figure shows the −log10(p-value) for testing associations between 156 retinal imaging traits (46 derived OCT measures and 110 fundus image traits) and 458 brain MRI traits, comprising 101 regional brain volumes, 63 cortical thickness traits, 110 diffusion tensor imaging (DTI) parameters, 92 resting fMRI traits, and 92 task fMRI traits. Supplementary Data 1 provides further information on these imaging traits. The red dashed horizontal line signifies the Benjamini–Hochberg FDR 5% significance level (raw P < 4.37 × 10⁻⁴). Each brain imaging modality is marked with a different color, and the brain structures with the strongest associations in each modality are labeled. B, C The location of brain regions with volumes significantly associated with B the thickness of the ganglion cell and inner plexiform layer (GCIPL, right eye) and C the overall thickness of the macula (right eye). D The location of cortical brain regions exhibiting a significant association between their thickness and the thickness of GCIPL (left eye). E, F The location of white matter tracts with DTI parameters associated with E the thickness of GCIPL (left eye) and F the overall thickness of the macula (left eye). AD axial diffusivity, RD radial diffusivity, MO mode of anisotropy, FA fractional anisotropy. For all associations, we used two-sided t-tests and adjusted for multiple comparisons. Matplotlib157 contributed to the creation of this figure.

