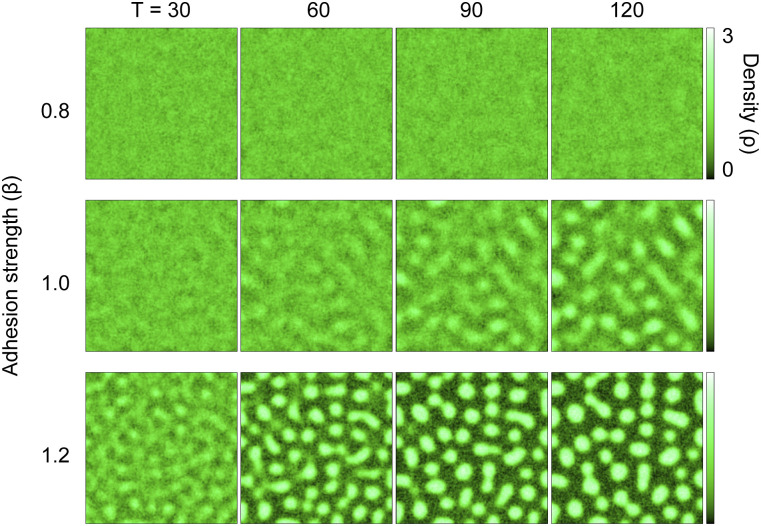
Figure 4. A mathematical model simulates a spatial density pattern using two variables: cell density and stress caused by adhesion.
A two-dimensional cell density model predicted the emergence of spatial patterns of cell distribution, depending on adhesion strength. The color represents the local cell density ρ. Simulations for three different values of β (adhesion strength) are shown, with time moments T [a.u.] = 30, 60, 90, and 120.

