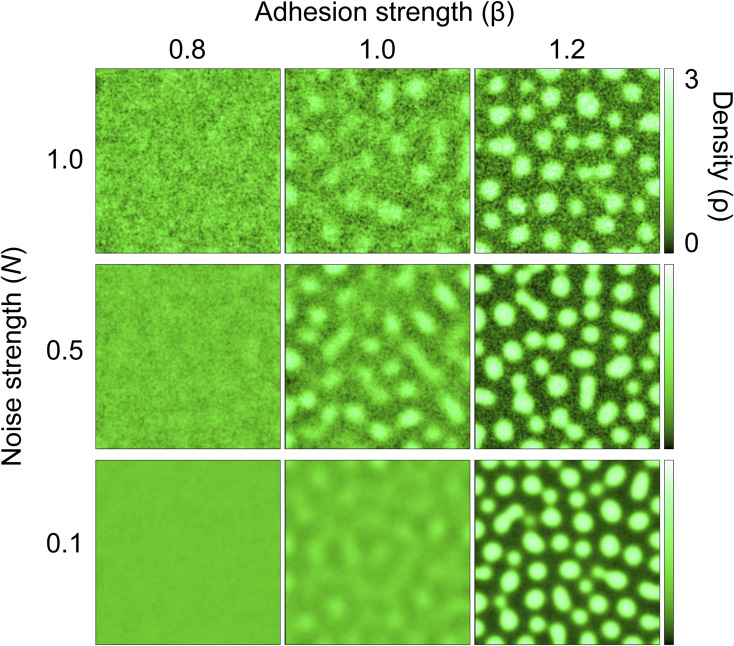
Figure S10. Mathematical modeling of a spatial density pattern using two variables: noise strength and adhesion strength.
Simulated patterns of spatial cell distribution for varying adhesion strengths (β) and noise strengths (N), with time moment T [a.u.] = 120. Data for N = 0.5 are the same as in Fig 4.

