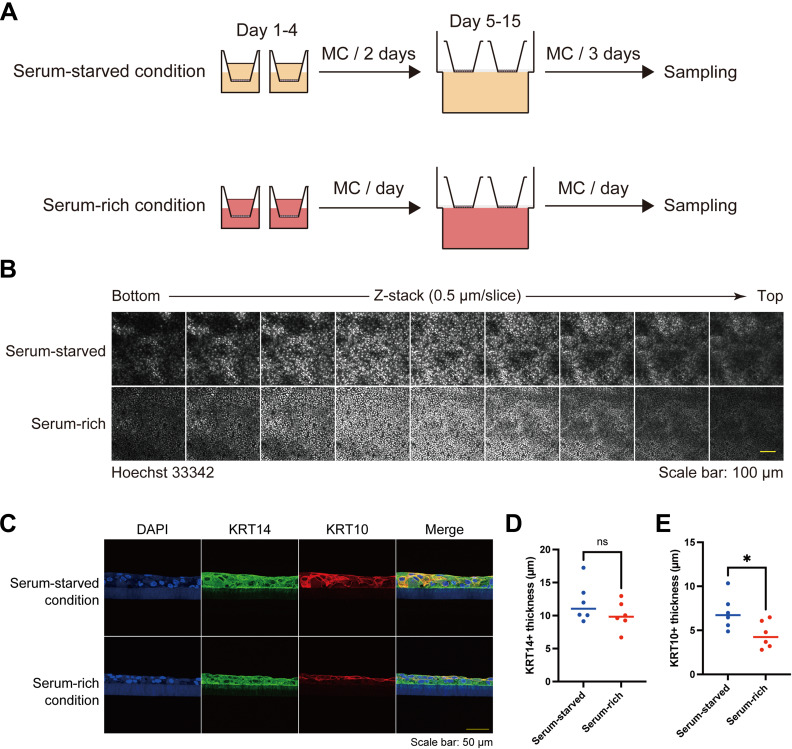
Figure S12. Keratinocyte patterns through air-liquid interface HaCaT keratinocyte culture in serum-starved and serum-rich conditions.
(A) Schematic diagram of air-liquid interface HaCaT keratinocyte culture in serum-starved and serum-rich conditions. (B) Immunofluorescent images of keratinocytes of air-liquid interface HaCaT keratinocyte culture. Nuclei are labeled with Hoechst 33342. Z-stack images are aligned from the bottom to the top. Z-stack depth: 0.5 μm/slice. Scale bar: 100 μm. (C) Immunofluorescent section images of air-liquid interface HaCaT keratinocyte culture. DAPI (blue); KRT10 (magenta); KRT14 (green). Scale bar: 50 μm. (D, E) Quantification of KRT14+ and KRT10+ thickness in the air-liquid interface cultures under serum-starved and serum-rich conditions. N = 6 for each group. All data are presented as mean values and were analyzed with two-tailed Mann–Whitney U tests. ns, not significant. *P < 0.05.

