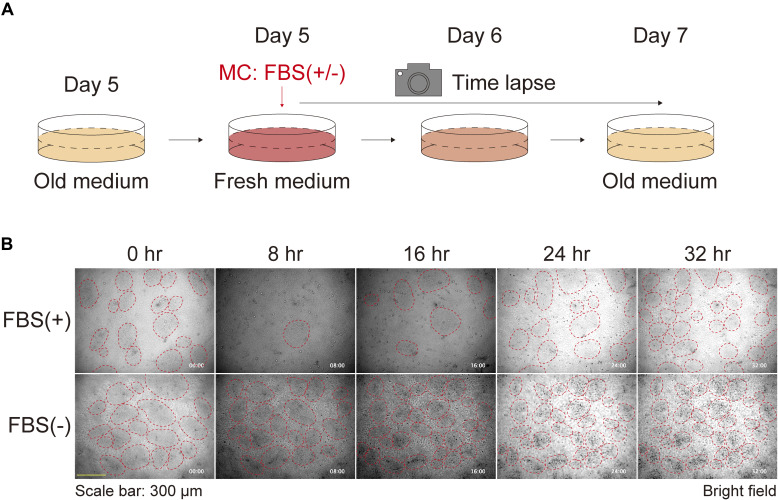
Figure S6. Keratinocyte patterns after medium replenishment with or without FBS.
(A) Schematic diagram of time-lapse experiments for observing the keratinocyte patterns after medium replenishment with or without FBS. (B) Phase contrast time-lapse images of keratinocytes. Representative images are shown at 8-h time intervals. Red dotted circles were manually added to identify high-density patterns. Each image is timestamped in hours and minutes. Scale bar: 300 μm.

