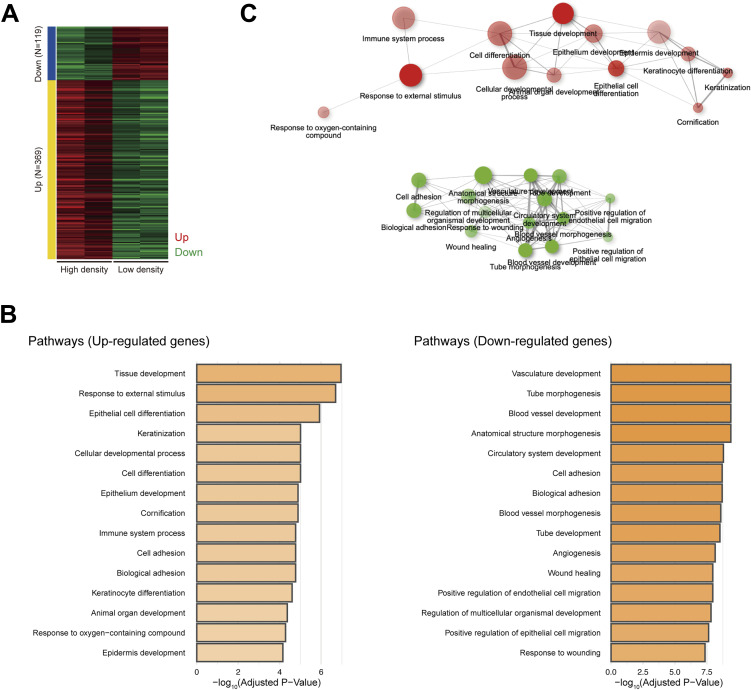
Figure S7. RNA sequencing analysis comparing keratinocytes under a low- or high-density cell culture.
(A) Heatmap of differentially expressed genes identified by RNA sequencing (RNA-seq) comparing keratinocytes under a low- or high-density cell culture. (B) Gene ontology biological process terms enriched in up-regulated and down-regulated genes. (C) A network of gene ontology biological process terms enriched in up-regulated and down-regulated genes.

