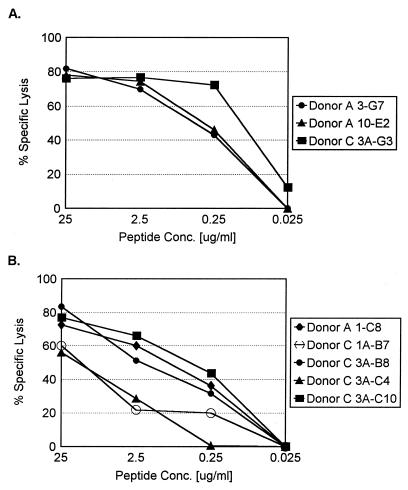
FIG. 3.
Peptide dose-response curves for N-protein-specific cell lines isolated from donors A and C. Autologous BLCL were pulsed with an optimal 9-mer peptide epitope recognized by the T-cell lines at the indicated concentrations (Conc.). (A) Cell lines from donors A and C specific for N protein amino acids 12 to 20. (B) Cell lines specific for N protein amino acids 421 to 429. Data from a representative experiment are shown.

