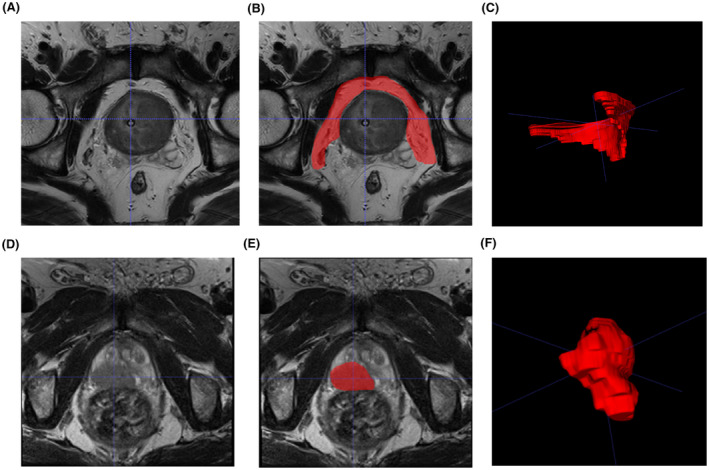
FIGURE 1.

Schematic diagram of PPF and intratumoral ROI in MRI images of prostate cancer patients. (A) T2WI sequence showing prostate cancer in the PPF region. (B) Outline of the PPF ROI in the T2WI sequence. (C) Generated PPF ROI in the T2WI sequence. (D) T2WI sequence showing prostate cancer in the intratumoral region. (E) Outline of the intratumoral ROI in the T2WI sequence. (F) Generated intratumoral ROI in the T2WI sequence. ADC, apparent‐diffusion coefficient; MRI, magnetic resonance imaging; PCa, prostate cancer; PPF, periprostatic fat; ROI, regions of interest; T2WI, T2‐weighted imaging.
