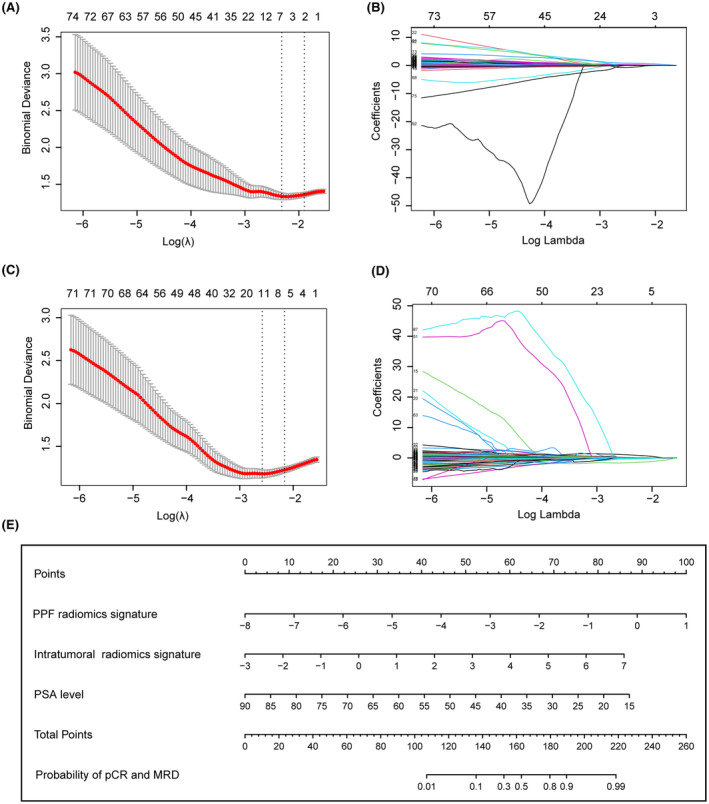
FIGURE 3.

Construction of radiomics signatures and radiomics‐clinical nomogram. (A, C) Partial likelihood deviance plotted against log (λ). The y‐axis represents the partial likelihood deviance, while the lower x‐axis indicates log (λ), and the upper x‐axis represents the average number of predictors. Dotted vertical lines indicate the optimal values determined by the minimum criteria and 1 standard error of the minimum criteria. The tuning parameter (λ) was selected in the LASSO model via 10‐fold cross‐validation based on minimum criteria. (B) Six features with nonzero coefficients were selected to build the PPF radiomics signature. (D) Six features with nonzero coefficients were selected to build the intratumoral radiomics signature. (E) The nomogram for predicting positive pathological response to NCHT. LASSO, least absolute shrinkage and selection operator; NCHT, neoadjuvant chemohormonal therapy; PPF, periprostatic fat.
