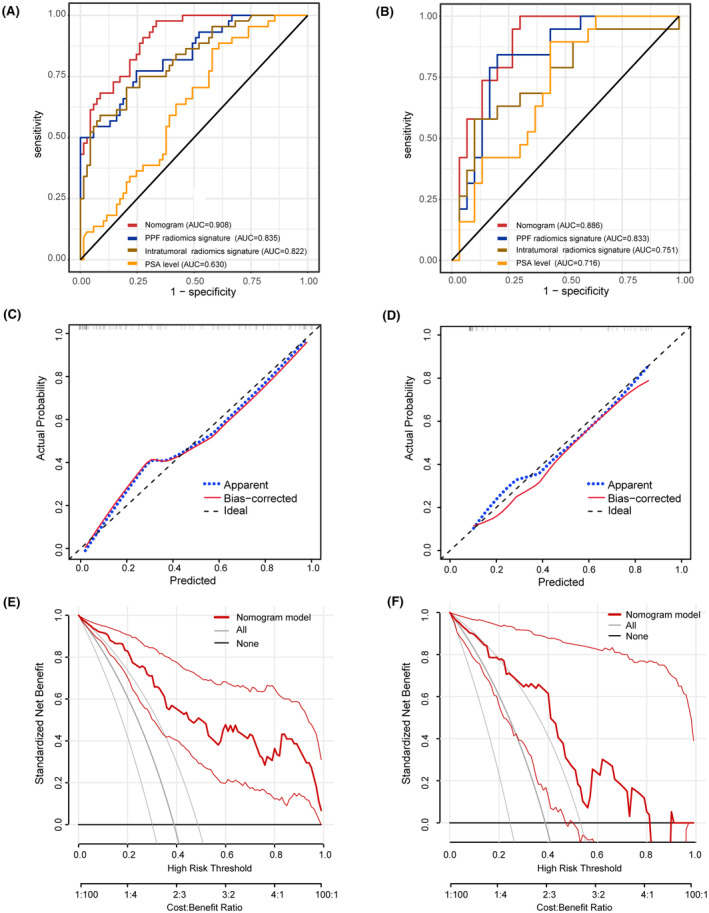
FIGURE 4.

Validation of the radiomics‐clinical nomogram. (A, B) Receiver operating characteristic curve analysis of the nomogram and three independent predictors. (C, D) Hosmer–Lemeshow goodness‐of‐fit test was used to evaluate model calibration in both the training group (χ 2 = 8.843, p = 0.356) and the validation group (χ 2 = 5.200, p = 0.736). (E, F) Decision curve analysis demonstrated that the nomogram can facilitate clinical decision‐making within a considerable risk threshold.
