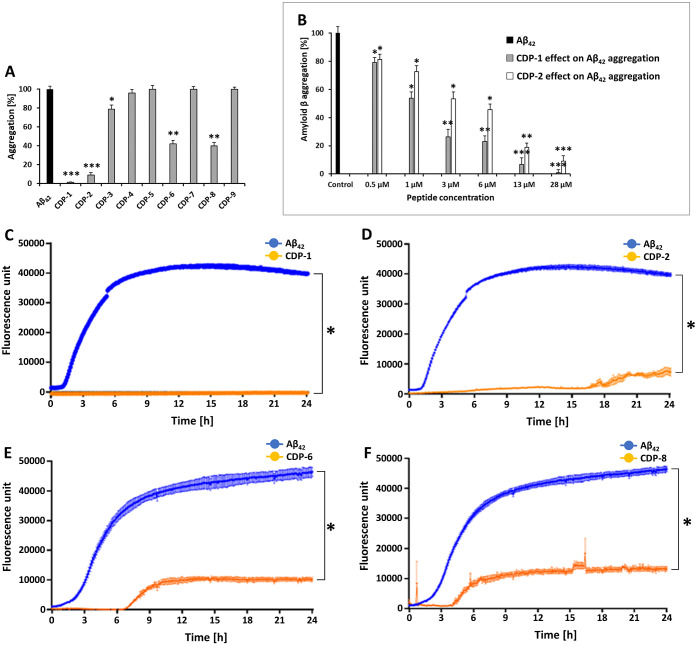
Figure 1.
The effect of CDPs on Aβ42 aggregation using Thioflavin T assays. The ThT fluorescence signal with only Aβ42 is shown in blue. In orange is the action of CDP-1, -2, -6, and -8 in the signal of Thioflavin T, which decreased over time. (A) Provides an overview of the effect of the tested peptides against Aβ42 aggregation. (B) Demonstrates the effect of different doses of CDP-1 and CDP-2 (0.5, 1, 3, 6, 13, and 28 μM) on Aβ42 aggregation. The end point is shown for the relative fluorescence during a ThT assay. The Aβ42 aggregation serves as the control. (C) The effect of CDP-1 against Aβ42 aggregation. (D) The effect of CDP-2 against Aβ42 aggregation. (E) The effect of CDP-6 against Aβ42 aggregation. (F) The effect of CDP-8 against Aβ42 aggregation. Data shown are the mean ± SEM from three independent measurements (n = 3). Asterisks mean that the data differ from the Aβ42 control significantly at *p < 0.05, **p < 0.01, and ***p < 0.001 levels according to analyses by two-way ANOVA.

