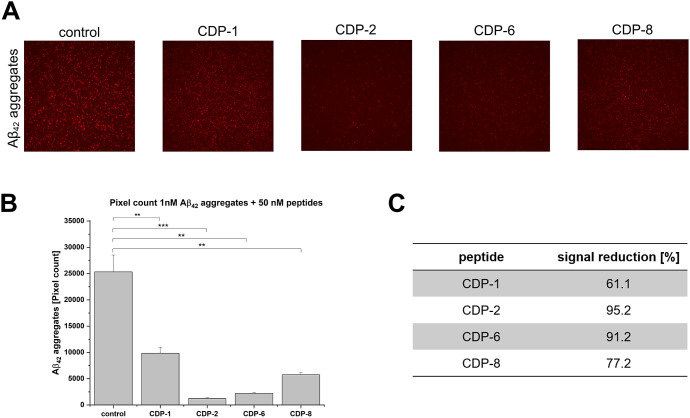
Figure 3.
sFIDA experiments to follow Aβ42 aggregates elimination by CDPs. Antibody Nab228 was captured on the plate surface. After incubation of the samples, the Aβ targets were detected with IC-16 labeled with CF633. The assay surface was then imaged with the TIRFM. (A) TIRFM images of 1 nM Aβ42 aggregates (1 nM) were treated with 50 nM CDPs or without CDPs (control). (B) Pixel count analysis of the TIRFM images from A. One nM Aβ42 aggregates treated with 50 nM CDPs or without CDPs (control). (C) Each peptide’s signal reduction compared with the control (1 nM Aβ42 aggregates). The data presented represent the mean ± SEM from three independent measurements (n = 3). Asterisks denote significant differences from the control group, where ** indicates p < 0.01 and *** indicates p < 0.001 levels of significance, as determined by analyses conducted through a two-sample t test.

