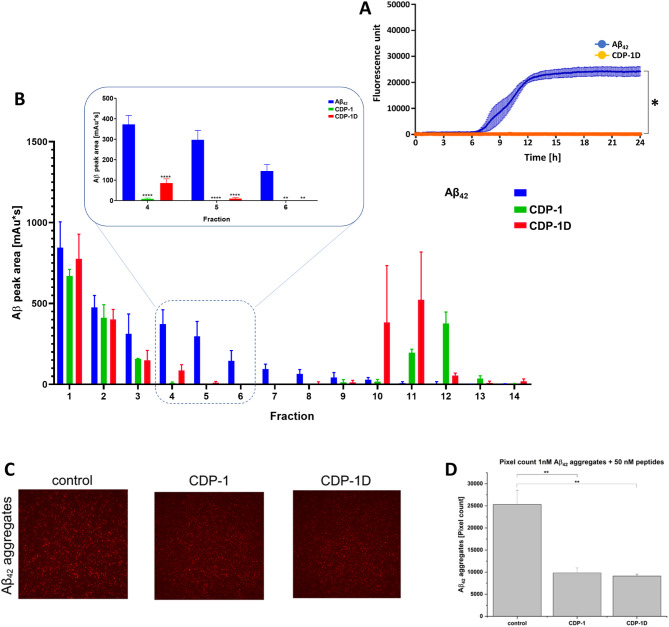
Figure 4.
The effect of CDP-1D against Aß42 aggregation and toxic Aß42 aggregates. (A) D-CDP-1 inhibits Aβ42 aggregation in the Thioflavin T assay (orange). The ThT fluorescence signal with only Aβ42 increased over time (blue). (B) Eliminated Aβ42 oligomers in the QIAD assay. The results are shown in comparison with the mother l-peptide CDP-1. (C) sFIDA assay results for CDP-1 and CDP-1D. TIRFM images of Aβ42 aggregates treated with CDP-1 and CDP-1D. (D) Pixel count analysis of the TIRFM images from C. The data presented represent the mean ± SEM from three independent measurements (n = 3). Asterisks denote significant differences from the control group, where ** indicates p < 0.01 levels of significance, as determined by analyses conducted through a two-sample t test.

