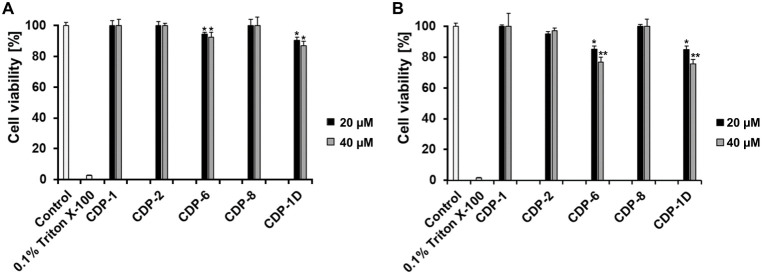
Figure 5.
MTT assay of CDPs in SH-SY5Y and HEK293 cells. MTT assay evaluated the cytotoxicity of four l-peptides and one d-peptide. The effects of 20 and 40 μM peptides on the viability of both cell lines are shown. The complete MTT assay (concentrations tested between 0 and 100 μM) for each peptide is shown in Figures S7 and S8. The control shows the cell viability without peptide, and 0.1% Triton X-100 was used as the negative control. (A) SH-SY5Y cell line and (B) HEK293 cell line. The data displayed represent the mean ± SEM from three independent measurements (n = 3). Asterisks indicate significant differences from the control group, where * represents p < 0.05 and ** represents p < 0.01 levels of significance, as determined by analyses conducted through two-way ANOVA.

