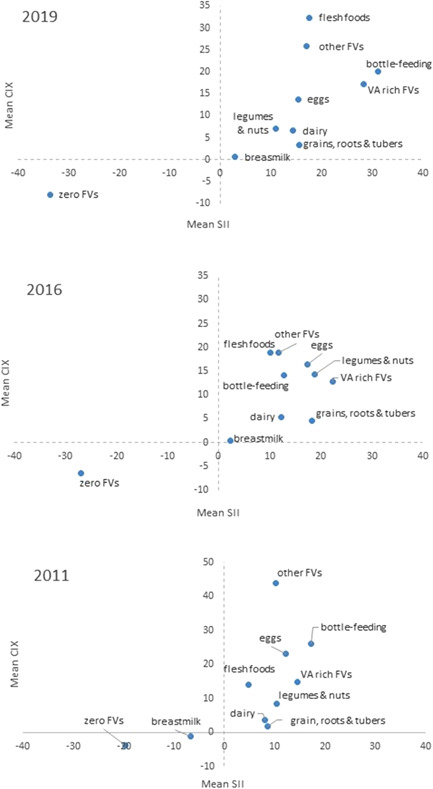
Figure 4.

Food group‐level inequality, 2011–2019. SII reflects absolute inequality; whereas CIX reflects relative inequality between the highest and the lowest wealth quintile; positive values present a pro‐rich distribution, whereas negative values represent a pro‐poor distribution; the origin of the graph (0,0) represents absolute equality. Values further away from zero represent higher inequality. CIX, concentration index.
