
Figure 2.
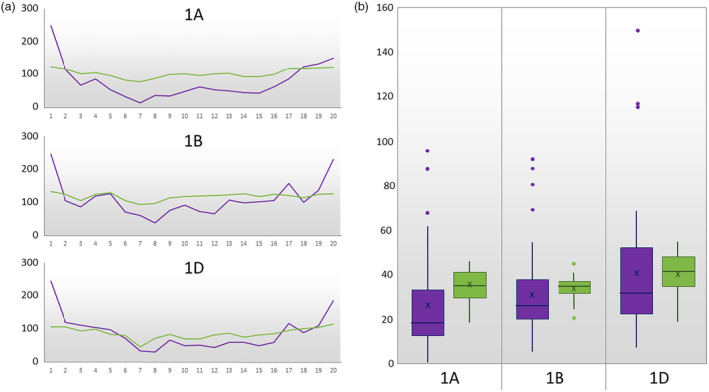
The physical distribution of chromosome 1 markers on the TaNG v1.1 (green) and 35K Wheat Breeder's Arrays (purple). (a) Number of markers in each of 20 bins spanning the chromosome. (b) Box and whisker plots of the number of markers per 10 Mb bin across the chromosome. There is a greater number of markers on the TaNG v1.1 Array (green boxes) and these are more evenly distributed than on the 35K Array (purple boxes). See Data S5 for plots of all chromosomes.