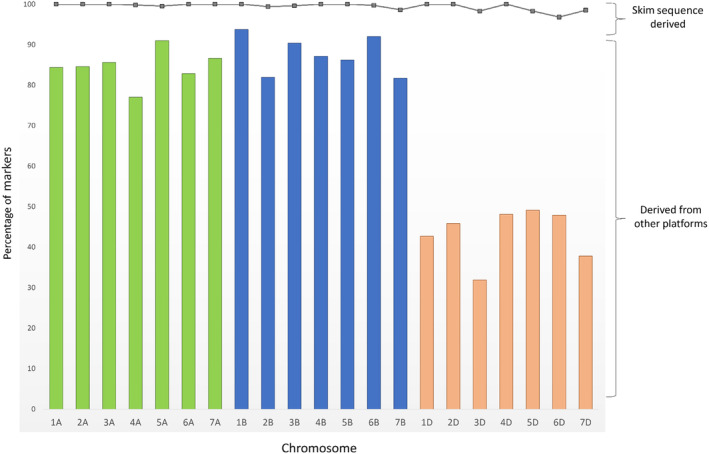
Figure 4.

Comparison of chromosome location for markers based on physical and consensus assignment. Only markers with a consensus chromosome assignment are shown. Markers with physical positions derived from previous genotyping platforms (820K Array, 35K Array and DArT markers) are represented by bars. Markers derived from skim sequence data are represented by a line plot.
