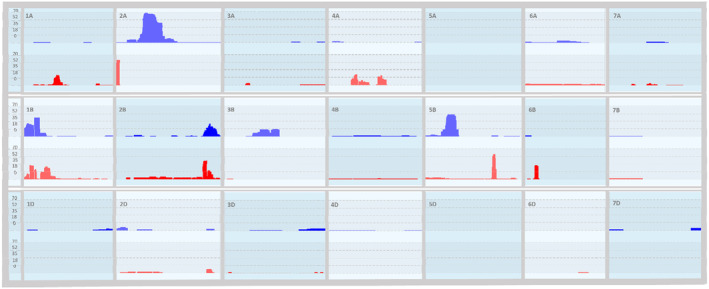
Figure 5.

Copy Number Variance (CNV) frequency histogram for all samples genotyped with the TaNG v1.1 array in the initial screening (Data S4) across all chromosomes. Regions of copy number gain are displayed in the top track (blue) and regions of copy number loss are displayed on the bottom track (red) for each chromosome. Start and stop positions of each event are listed in Data S7.
