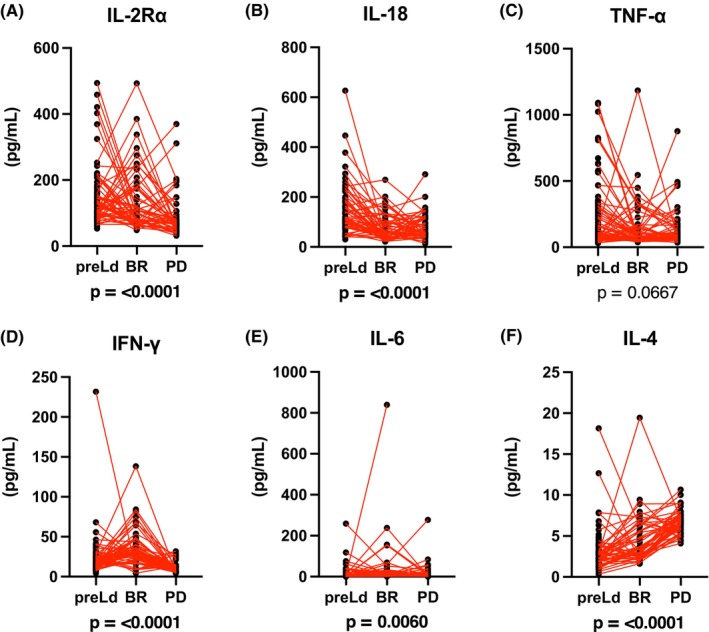
FIGURE 4.

Comparison of serum cytokine levels in patients with MM treated with Ld therapy at different disease stages. (A–F) Levels of each cytokine at different disease stages (i.e. pre‐Ld therapy (pre‐Ld), at the best response (BR), and progressive disease (PD)) were shown.
