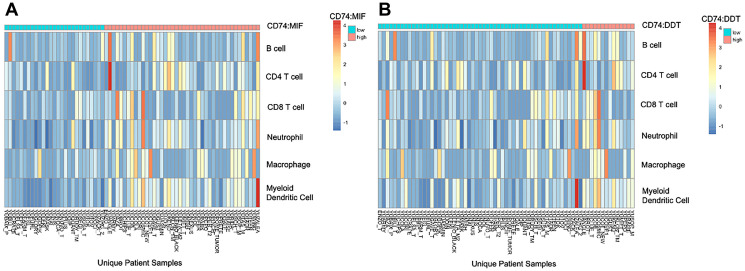
Figure 6.
Tumor infiltrating immune cell profiling according to high (cyan) and low (salmon) CD74:MIF levels (A) and CD74:DDT levels (B) using TIMER2.0 deconvolution analysis. Cut points for high and low values was determined using the surv_cutpoint approach on Rstudio. An increase in intratumoral inflammatory markers are evident in high CD74:MIF and CD74:DDT cohorts when compared to their respective low cohorts.

