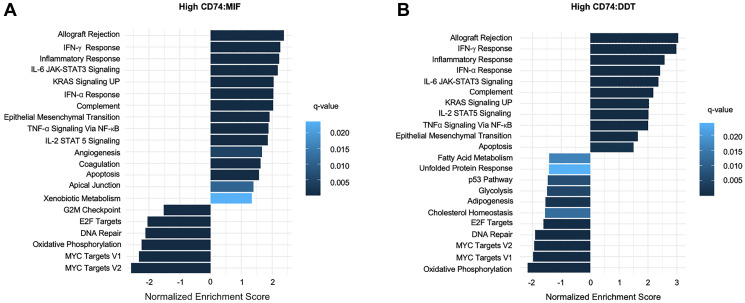
Figure 7.
Gene Set Enrichment Analysis (GSEA) bar plot representation of (A) high CD74:MIF and (B) high CD74:DDT differentially expressed OS data using MSigDB Hallmarks gene collection set. Differential expression analysis reveals an upregulation of inflammatory-related pathways in reference to corresponding low CD74:MIF and low CD74:DDT data.

