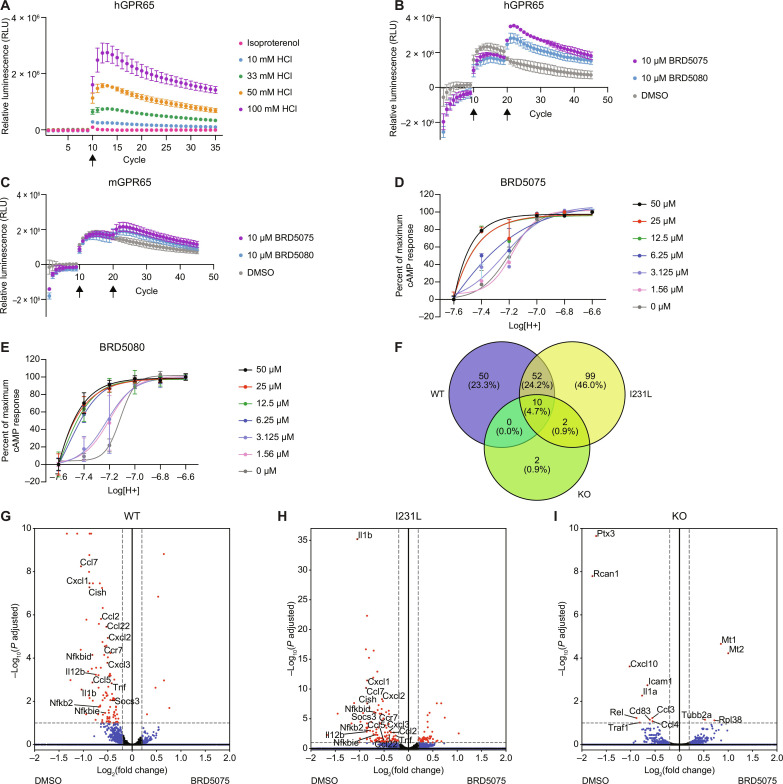
Fig. 4. PAMs BRD5075 and BRD5080 demonstrate target engagement with hGPR65 and mGPR65.
(A) pH-dependent increase in LgBiT-mGs recruitment to hGPR65-SmBiT in Expi293T cells in response to increasing concentrations of HCl added at cycle 10 (mean ± SD, n = 3). (B and C) Increased LgBiT-mGs recruitment with 10 μM BRD5075 or BRD5080 in Expi293T cells expressing (B) hGPR65-SmBiT and (C) mGPR65-SmBiT. pH was decreased at cycle 10 with 25 mM HCl, and compound was added at cycle 20. Data were normalized to cells treated with H2O at cycle 10 followed by DMSO at cycle 20 (mean ± SD, n = 3). (D and E) pH-dependent cAMP production in the presence of 0 to 50 μM (D) BRD5075 and (E) BRD5080, showing positive allosteric modulation of GPR65 in hGPR65-expressing HeLa cells. pH curves were normalized to pH 6.6 for maximum response and 7.6 for minimum (mean ± SD, n = 4). Data represent at least two independent experiments. (F) Venn diagram of significant DEGs in BMDCs isolated from WT, I231L, and KO mice treated with BRD5075 compared to DMSO at pH 7.2 (n = 3 technical replicates, one mouse per genotype). (G to I) Differential expression of genes in (G) WT, (H) I231L, and (I) KO BMDCs treated with BRD5075 compared to DMSO at pH 7.2. Red dots are significant DEGs defined by Padj < 0.1 and log2(fold change) > |0.2|. Blue dots indicate DEGs that meet the threshold for fold change but not significance. Green dots indicate significant DEGs that do not meet the threshold for fold change. Black dots are DEGs that do not meet either threshold. 1 cycle = 90 s.

