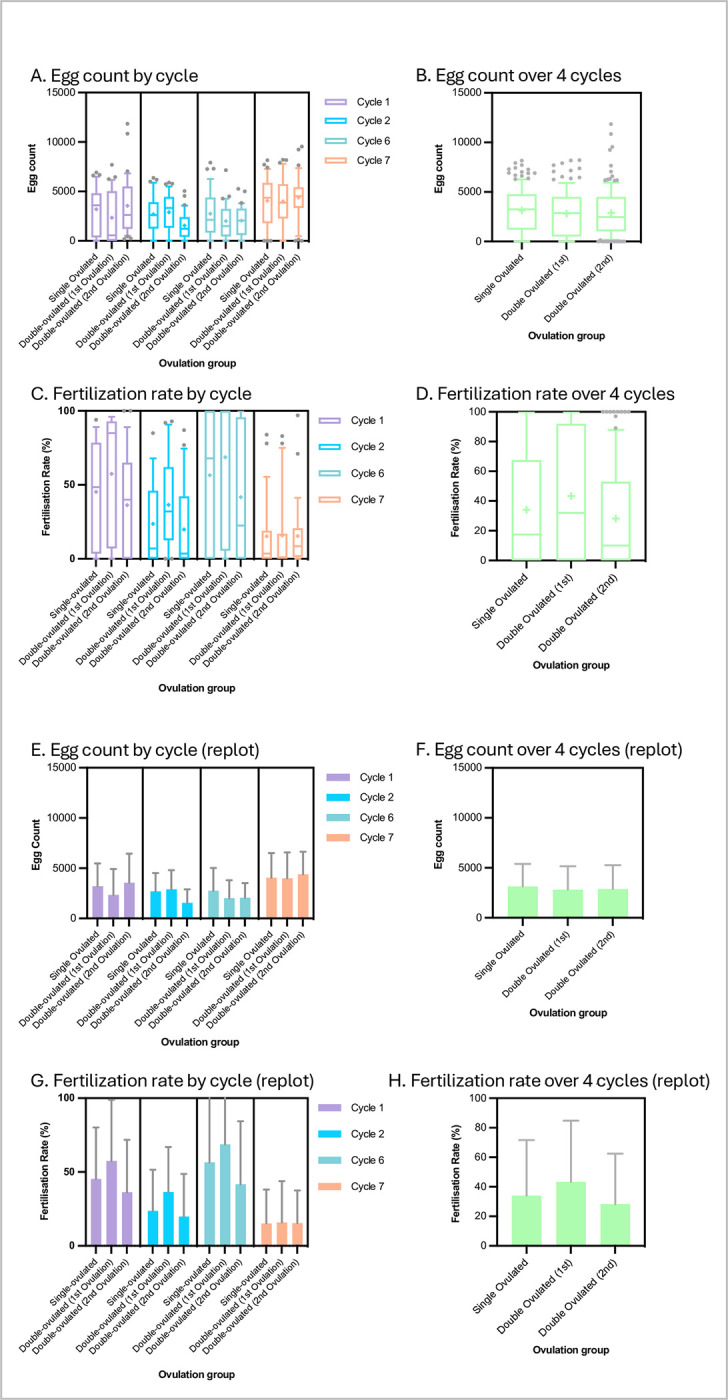
Fig 1. X. laevis egg yields and fertilisation rates under single- and double-ovulation protocols are similar.

A, E, B, F: Numbers of eggs laid in 10 hours (9.00 am to 7.00 pm following hCG injection the previous evening) for each condition in the specific ovulation cycles shown (A, E) and for all four ovulation cycles pooled (B, F). C, G, D, H: Percentage of fertilised (cleaving) eggs from a ~200 egg sample in the specific ovulation cycles shown (C, G) and for all four ovulation cycles pooled (D, H). Data are plotted as box-and-whisker format (whiskers at 10/90th percentiles, bar at median, cross at mean) to show variability (A-D) and re-plotted as histograms (mean +/- standard deviation) (E-H) to show trends at a glance. Sample numbers: n ≥ 31 for each condition in each cycle and so ≥ 124 for pooled cycles (see Supporting Information S1 Appendix for raw data).
