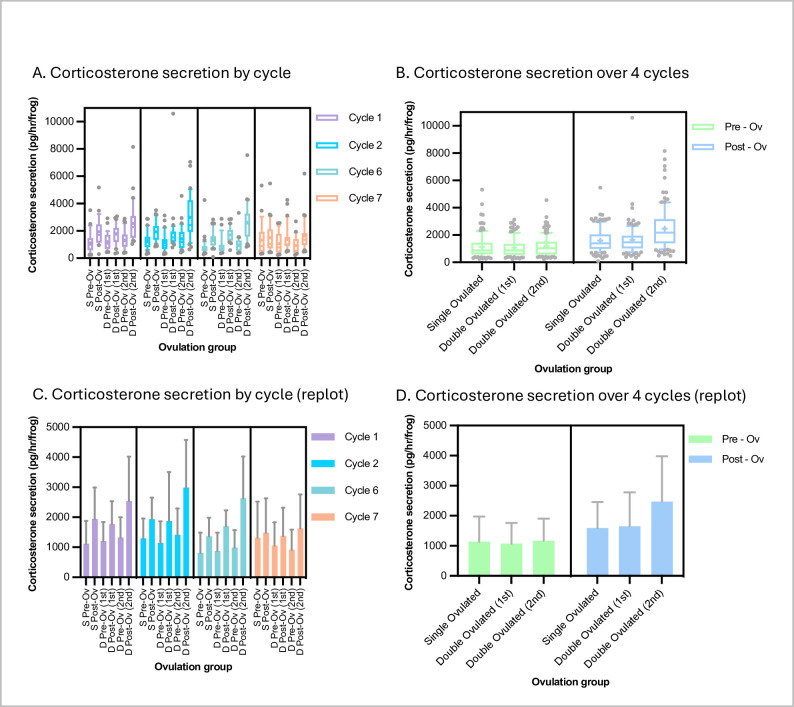
Fig 2. X. laevis corticosterone secretion under single- and double-ovulation protocols.
Corticosterone secretion (pg/hr) values for each condition in the specific ovulation cycles shown (panels A and C) and for all four ovulation cycles pooled (panels B and D). Data are plotted as box-and-whisker format (whiskers at 10/90th percentiles, bar at median, cross at mean) to show variability (panels A and C) and re-plotted as histograms (mean +/- standard deviation) (panels B and D) to show trends at a glance.

