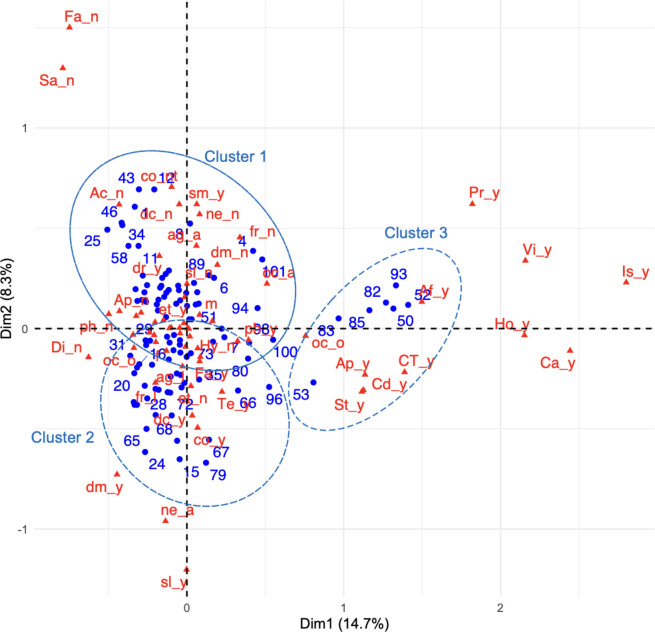
Fig 1. MCA biplot positioning of patients and variables, vis-à-vis both dimensions.
Small blue circles represent the patients. Red triangles represent the variables. The variable names are as shown on the right side of Table 1. Large dotted circles indicate clusters.

