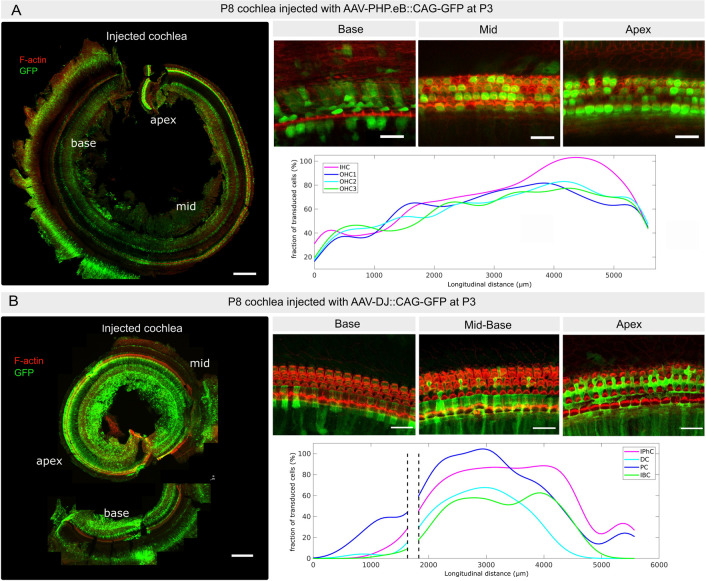
Fig 1. Inner ear transduction efficiency of AAV-PHP.eB and AAV-DJ administered at the neonatal stage.
(A) P8 cochlea injected at P3 with AAV-PHP.eB through the round window membrane. The image on the left shows F-actin (red) and transduced cells expressing GFP (green) in maximum projection in the same cochlea. Upper panels on the right show representative close-ups of the sensory epithelium at the cochlear base, mid, and apex; the graph below shows the corresponding longitudinal transduction profile (fraction of transduced sensory cells as a function of position) along the cochlear axis, the latter being oriented from base, x = 0, to apex, x ≃ 5700 μm). IHC: Inner hair cells; OHC1-3: Outer hair cells from row 1–3. (B) P8 cochlea injected at P3 with AAV-DJ through the round window membrane. The image on the left shows F-actin (red) and transduced cells expressing GFP (green), in maximum projection in the same cochlea that was cut into two pieces. Panels on the right show representative close-ups of the sensory epithelium (base, mid and apex); the corresponding longitudinal transduction profile (shown below) was obtained by combining the partial profiles obtained in the respective cochlear fragments. Note that AAV-DJ also transduces the inner sulcus and mesenchymal cells. IPhC: Phalangeal cells; DC: Deiter cells; PC: pillar cells; IBC: inner border cells. Scale bar 200 μm.

