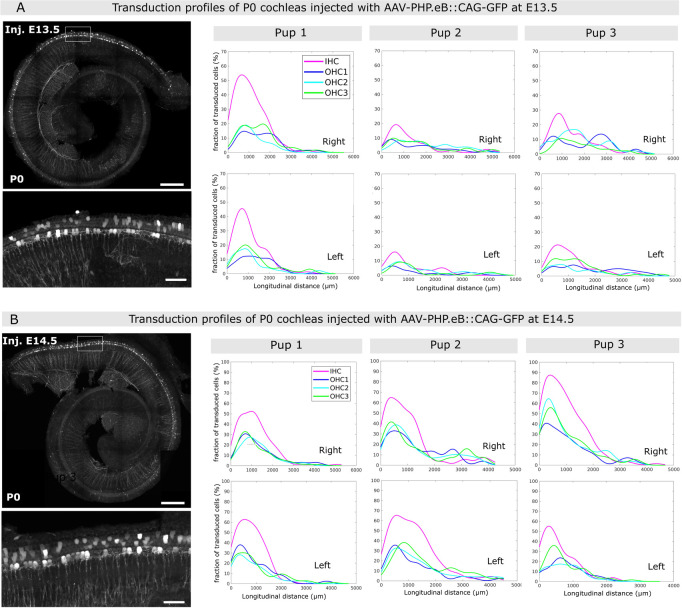
Fig 3. Inner ear transduction efficiency of AAV-PHP.eB administered at embryonic stages E13.5 and E14.5.
(A-B) Whole-mount P0 cochleas injected with AAV-PHB.eB::GFP at E13.5 (A) and at E14.5 (B). Images on the left show stitched and projected views of the whole-mount cochleas imaged by mosaic confocal microscopy. Inset images below show the transduced sensory cells in more detail. Scale bars in overview images, 200 μm, in the insets, 25 μm. The graphs on the right show representative longitudinal transduction rate profiles measured in the right and left cochleas of 3 pups injected at E13.5 (A), and 3 pups injected at E14.5 (B). See also S3 Fig, which contains additional transduction rate profiles for 3 pups injected at E13.5 and 3 pups injected at E14.5. IHC, inner hair cells, OHC1, OHC2, and OHC3, first, second and third row of outer hair cells, respectively.

