. 2024 Jul 19;12:RP92110. doi: 10.7554/eLife.92110

Figure 2. EFRY836F and EFRSSAA impair the active kinase conformation, which is required for signaling function.

(A) (left) HDX-MS results for unphosphorylated EFR and EFRY836F protein. The difference in percent H/D exchange in wild type EFR and EFRY836F is expressed as the Δ%EX (wild type EFR – EFRY836F), with the positive and negative Δ%EX indicating more stabilized and destabilized regions in EFRY836F, respectively, compared to wild-type EFR. The Δ%EX values at different labeling time points are shown as colored lines, as indicated in the figure. The horizontal dotted black lines indicate the 98% confidence interval for the Δ%EX data (±7.18%, corresponding to ±0.4 Da difference between wild type and Y836F percent exchange) calculated as described previously (Houde et al., 2011). Regions with Δ%EX values that exceed this confidence limit are indicated as colored bars in the figure, including the β3-αC loop (orange), the catalytic loop plus part of αE (purple), and the A-loop (blue). These regions are colored in the AlphaFold2-derived model of the EFR kinase domain shown at right, in which Y836 is shown as a purple sphere. All data are the average of three independent biological repeats (n=3) with three technical repeat experiments each. A summary of the HDX-MS analysis is presented in Table 3. (B) HDX-MS analysis of representative peptides from regions with significantly different HD exchange. Frames are color-coded according to regions in A. Amino acid range of the peptides in full length EFR are indicated in the top left corner and the sequence below. (C, D) Secondary site mutation EFR F761[H/M] partially restores function of EFRY836F (C) and EFRSSAA (D). Full length EFR and its variants were expressed transiently in N. benthamiana and their function was tested in an oxidative burst assay. EFR F761H partially restored oxidative bursts of EFRY836F and EFRSSAA. Outliers are in indicated by asterisk in addition to the outlier itself and are included in statistical analysis; Statistical test: Kruskal-Wallis test (p<2.2*10–16 in C, p=1.163*10–7 in D), Dunn’s post-hoc test with Benjamin-Hochberg correction (p ≤ 0.05) Groups with like lowercase letter designations are not statistically different.

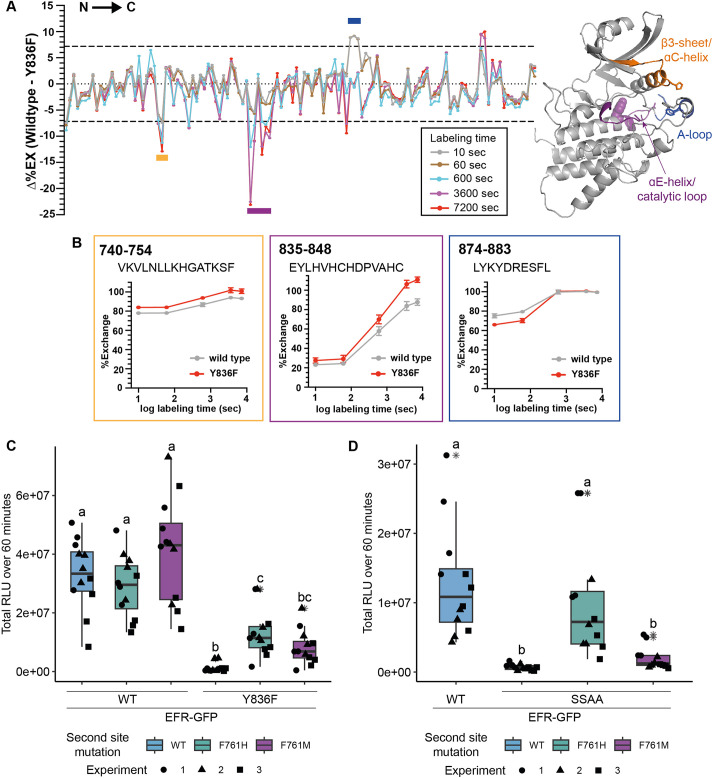
Figure 2.

Figure 2—figure supplement 1. VIa-Tyr forms H-bonds with the αC-β4 loop in various predicted and solved structures.

Figure 2—figure supplement 1.

Solved structures were retrieved from PDB. AlphaFold2 models for kinases in their active conformation were retrieved from Faezov and Dunbrack, 2023. BAK1 and EFR models were predicted by AlphaFold2, using the complete intracellular domain. H-bonds were predicted in ChimeraX and distances are indicated.
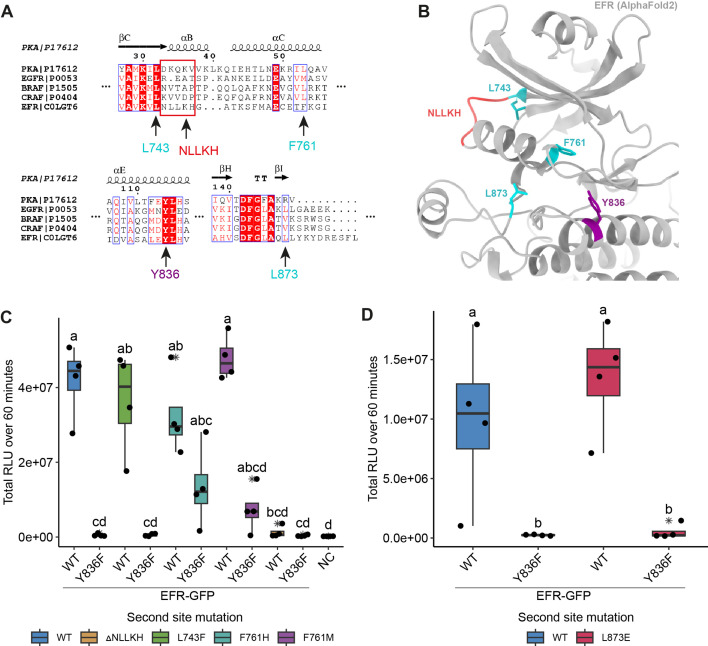
Figure 2—figure supplement 2. Rational design of activating mutations in EFR and screen for functional recovery of EFRY836F.

Figure 2—figure supplement 2.

(A) Alignments of EFR with human kinases containing oncogenic, kinase activating mutations that stabilize the αC-helix-in active-like conformation (described in Foster et al., 2016; Hu et al., 2015). Homologous sites in EFR are indicated by arrows with the residue number. (B) Structural model of the EFR kinase domain from AlphaFold2 with homologous sites identified in the sequence alignment from A highlighted in teal (missense mutation) or red (deletion). EFR Y836 at the C-terminal end of the αE-helix is colored purple. (C) Screening of the homology-based putatively activating EFR mutations for restoration of EFRY836F function in N. benthamiana. All putative activating mutations were functional at WT-like level except EFRΔNLLKH. Only EFRF761[H/M] could functionally recover EFRY836F as the oxidative burst was partially restored. (D) EFRL873E showed a WT-like oxidative burst but EFRL873E/Y836F did not restore the oxidative burst. Outliers are in indicated by asterisk in addition to the outlier itself and are included in statistical analysis; Statistical test: Kruskal-Wallis test (p=9.319*10–6 in C, p=0.01242 in D), Dunn’s post-hoc test with Benjamin-Hochberg correction (p ≤ 0.05) Groups with like lowercase letter designations are not statistically different.
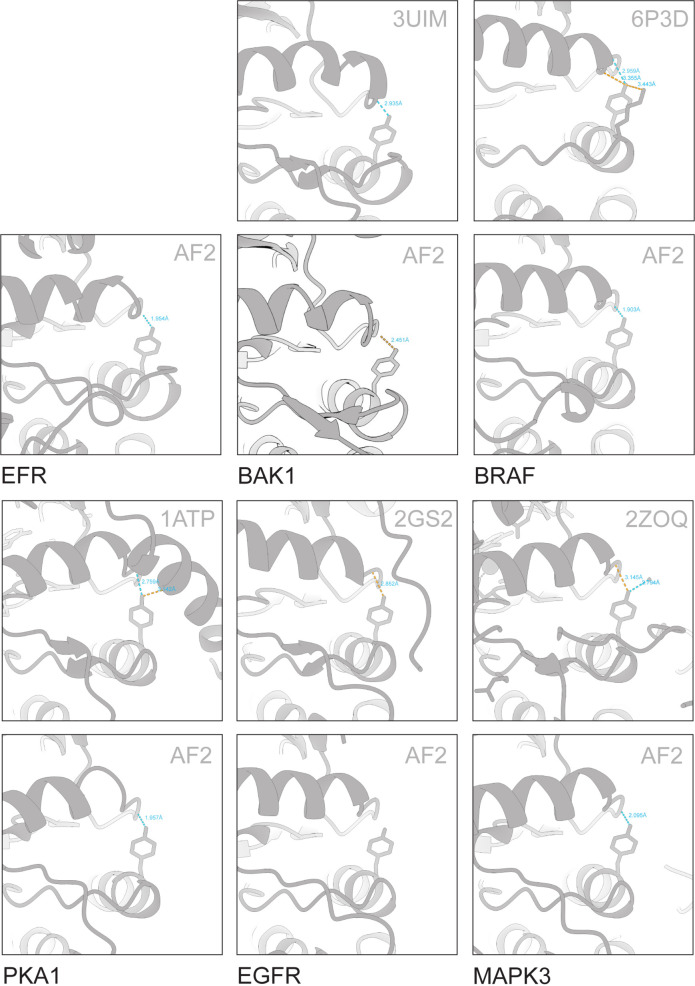
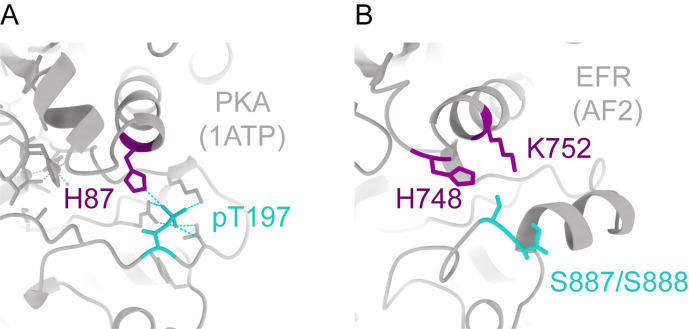
Figure 2—figure supplement 3. EFR A-loop phosphorylation sites may coordinate with basic residues from the β3-αC loop and αC-helix.

Figure 2—figure supplement 3.

(A) In PKA (1ATP), the A-loop phosphorylation on T197 coordinates with H87 from the αC-helix. (B) In EFR (AlphaFold2 (AF2) model), there are two basic residues extending downwards from β3-αC loop (H748) and αC-helix (K752) that may coordinate with A-loop phosphorylation on S887 or S888.