. 2024 Jul 19;12:RP92110. doi: 10.7554/eLife.92110

Figure 4. EFRF761H recovers BAK1Y403F function.

The cytoplasmic domains of BAK1 and EFR variants with fused RiD-tags were transiently expressed in N. benthamiana and leaf discs were treated with Rap to induce dimerization. EFR and EFRF761H induced a similar total oxidative burst when BAK1 was co-expressed. The co-expression of BAK1Y403F and EFR diminished the oxidative burst, which was restored partially when EFRF761H was co-expressed. Outliers are indicated by an additional asterisk and included in statistical analysis. Statistical test: Kruskal-Wallis test (p<8.516 *10–7), Dunn’s post-hoc test with Benjamin-Hochberg correction (p ≤ 0.05) Groups with like letter designations are not statistically different.

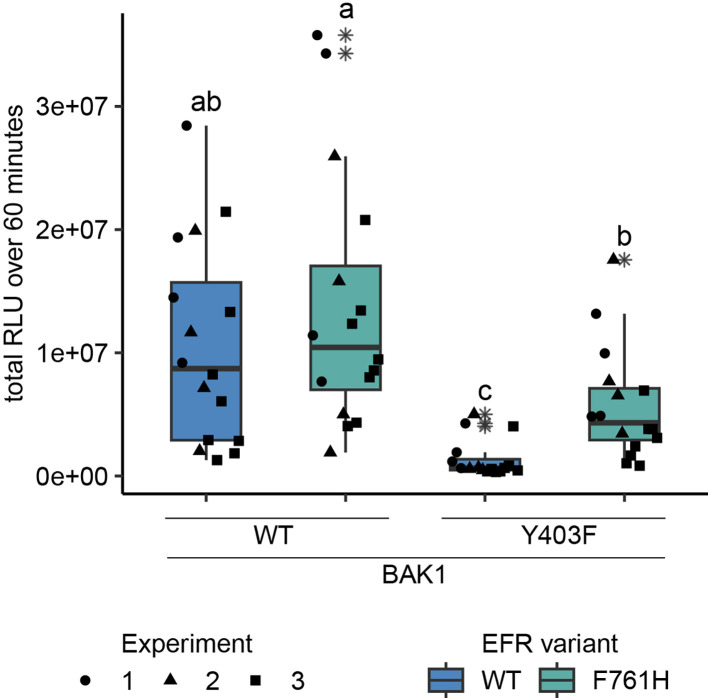
Figure 4.

Figure 4—figure supplement 1. Function of BAK1 Y403F is partially recovered by the secondary mutation I338H.

Figure 4—figure supplement 1.

(A) The RiD system was utilized to test the recovery of BAK1 Y403F by transient expression in N. benthamiana. The Y403F mutation in BAK1 diminished the oxidative burst, whereas BAK1 I338H displayed near WT-like responses. Combining the I338H and Y403F mutations, however, led to a partial recovery of oxidative burst. Outliers are indicated by an additional asterisk and included in statistical analysis. Statistical test: Kruskal-Wallis test (p<2.247 *10–11), Dunn’s post-hoc test with Benjamin-Hochberg correction (p ≤ 0.05) Groups with like letter designations are not statistically different. (B) SDS-PAGE analysis of protein levels in experiments 2 and 3 of A is shown. Protein accumulation data for experiment 1 was not collected.
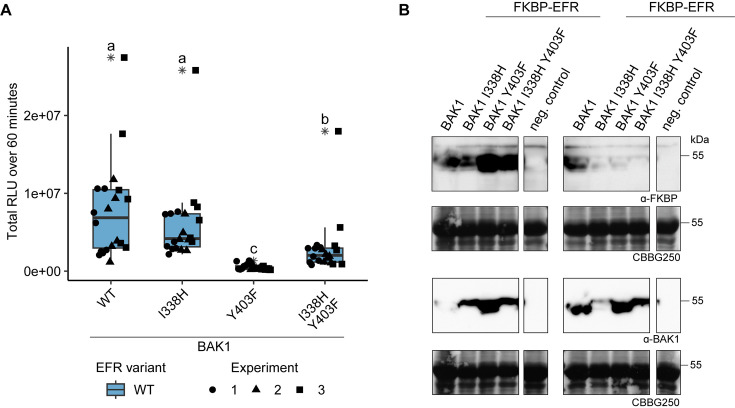
Figure 4—figure supplement 1—source data 1. Raw data for immunoblots shown in Figure 4—figure supplement 1B.
Figure 4—figure supplement 2. EFR F761H accelerates the onset of the oxidative burst but requires the catalytic activity of BAK1.

Figure 4—figure supplement 2.

(A) Quantification of the time until the oxidative burst reaches its half maximum from experiments presented in Figure 2B. Both putative activating mutations, F761H and F761M accelerate the onset of the oxidative burst. (B) Time resolved oxidative burst assay. Presented curves are from replicate number three as a representative example. Graphs in A and B are based on data presented in Figure 2B. Error bars represent standard error of the mean (n=4). (C) EFR F761H requires the catalytic activity of BAK1 to induce the oxidative burst. Data from three independent experiments is merged in one graph. (D) Protein accumulation of the RiD-tagged protein related to panel C. Statistical analysis in A and C: Outliers are indicated by an additional asterisk and included in statistical analysis. Statistical test: Kruskal-Wallis test (p=1.686*10–8 in A, p=5.89910–8 in C), Dunn’s post-hoc test with Benjamin-Hochberg correction (p ≤ 0.05) Groups with like letter designations are not statistically different.
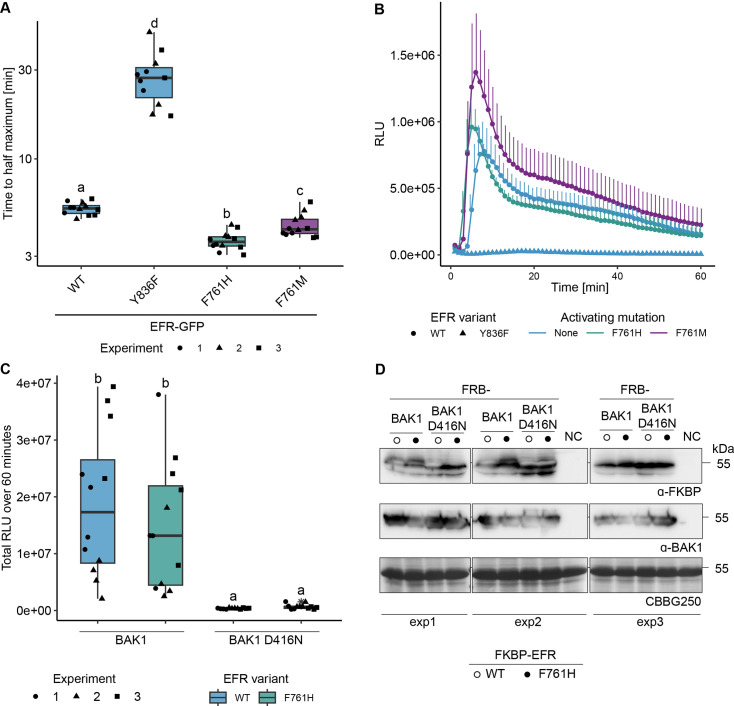
Figure 4—figure supplement 2—source data 1. Raw data for immunoblots shown in Figure 4—figure supplement 2D.
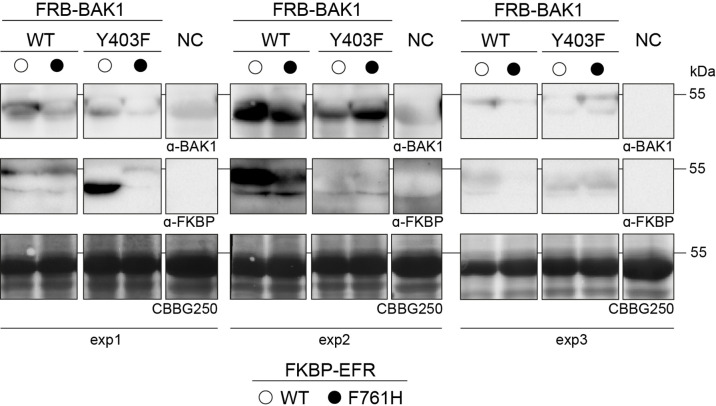
Figure 4—figure supplement 3. Protein accumulation for the oxidative burst assay in Figure 4.

Figure 4—figure supplement 3.

Leaf discs were collected after the oxidative burst assay and protein was extracted by boiling in SDS-loading buffer followed by immunoblotting. Non-infiltrated leaf discs served as negative control.
Figure 4—figure supplement 3—source data 1. Raw data for immunoblots shown in Figure 4—figure supplement 3.