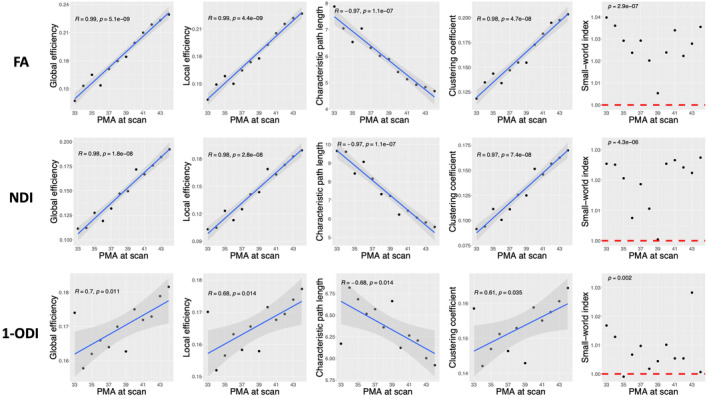
FIGURE 3.

Plots of different structural connectivity measures, computed with the parcellation nodes defined with the ENA50 atlas, versus PMA for the connectome edge weighting based on FA, NDI, and 1‐ODI. FA, fractional anisotropy; NDI, neurite density index; ODI, orientation dispersion index; PMA, postmenstrual age.
