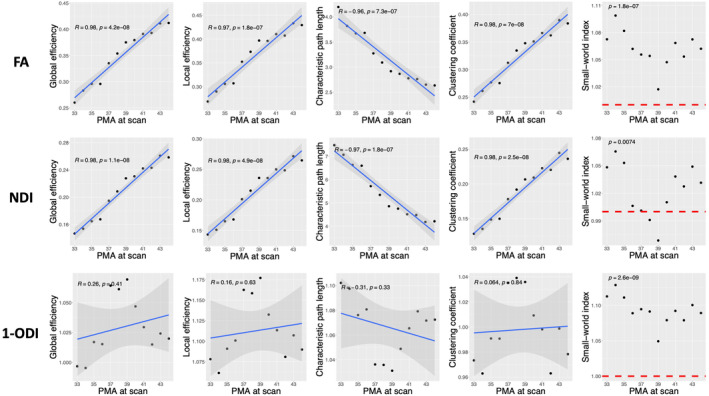
FIGURE 4.

Plots of different structural connectivity measures versus PMA for the connectomes computed with the length‐preserved connectome averaging technique. FA, fractional anisotropy; NDI, neurite density index; ODI, orientation dispersion index; PMA, postmenstrual age.
