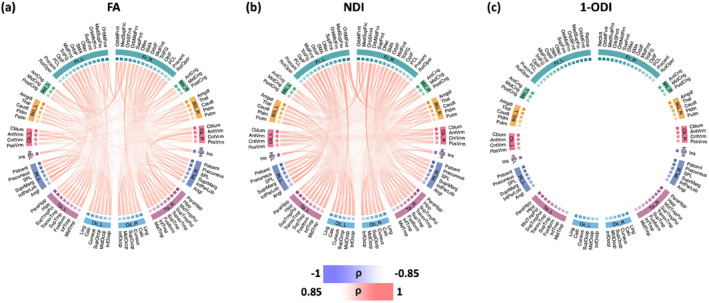
FIGURE 6.

Connectome edges that are significantly correlated with PMA, quantified in terms of Spearman's rank correlation coefficient () after Bonferroni correction for the length‐preserved connectome averaging method. The color intensity of the edges are proportional to . FA, fractional anisotropy; NDI, neurite density index; ODI, orientation dispersion index; PMA, postmenstrual age.
