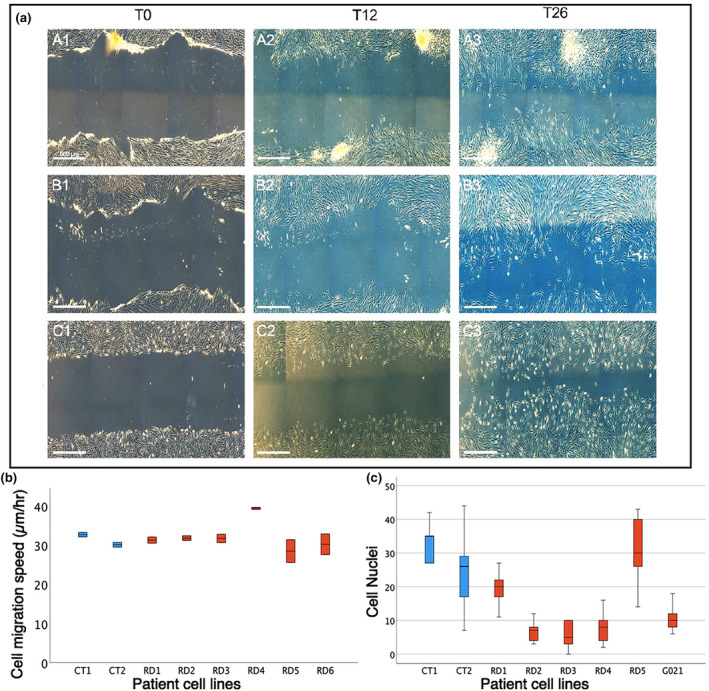
FIGURE 2.

Scratch cell migration and cell adhesion assays. Cell migratory speeds were calculated over a 26‐h period from scratch formation, measured at 5 points in two wells per cell line. (a1–a3) images show control cell migration (a). RD1 (c1–c3) and RD6 (b1–b3) fibroblast cell migration (a). Boxplot of mean cell migration speed (b). Boxplots of cell counts by cell line for cell adhesion assay of control (c‐shown in blue) and radial dysplasia (RD‐shown in red) cell lines (c).
