
. 2024 Jul 5;8:e55834. doi: 10.2196/55834
©Daisuke Sato, Koyuki Ikarashi, Fumiko Nakajima, Tomomi Fujimoto. Originally published in JMIR Formative Research (https://formative.jmir.org), 05.07.2024.
This is an open-access article distributed under the terms of the Creative Commons Attribution License (https://creativecommons.org/licenses/by/4.0/), which permits unrestricted use, distribution, and reproduction in any medium, provided the original work, first published in JMIR Formative Research, is properly cited. The complete bibliographic information, a link to the original publication on https://formative.jmir.org, as well as this copyright and license information must be included.
Figure 3.
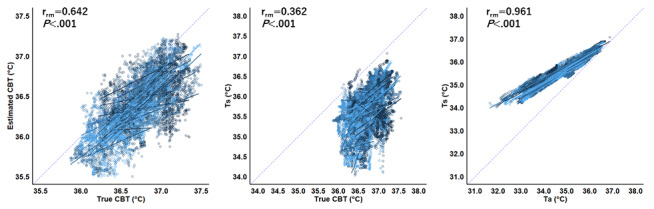
Repeated measures correlation plot for averaged data of 2 temperatures at the follicular and luteal phases.