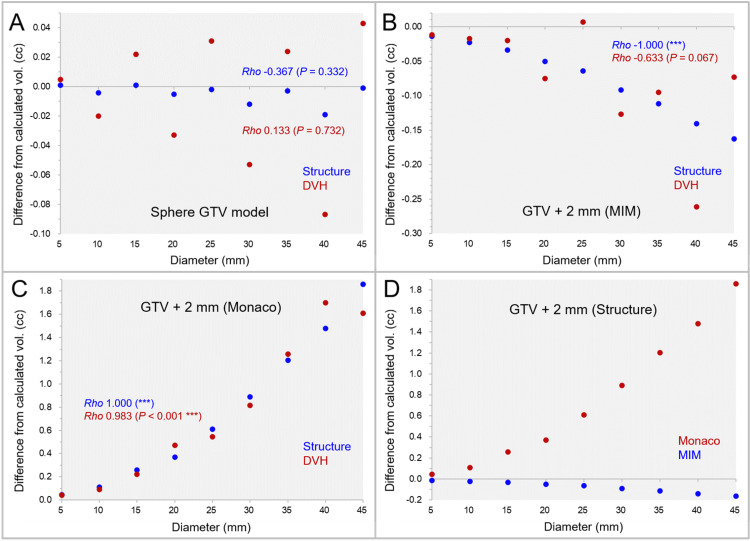
Figure 1. The accuracy of spherical model volumes and isotropic 2-mm margins compared to the calculated values, along with further variations on the dose-volume histograms.
The scatter plots show the differences between the sphere volumes by MIM Maestro with the diameters of 5-45 mm and the calculated values (A); the differences of the GTV + 2 mm structures by MIM Maestro from the calculated volumes (B); the differences of the GTV + 2 mm structures by Monaco from the calculated volumes (C); and the differences of the GTV + 2 mm structures between the systems (D), in which further volume variations in the dose-volume histograms (DVHs) are also shown. The results of Spearman’s rank correlation coefficient (SRCC) are added.
(A-D): The horizontal axes show the diameter of sphere volumes, and the vertical axes show the differences of the structure volumes from the calculated values.
vol: volume; GTV: gross tumor volume; GTV + 2 mm: GTV evenly expanded by 2 mm.

