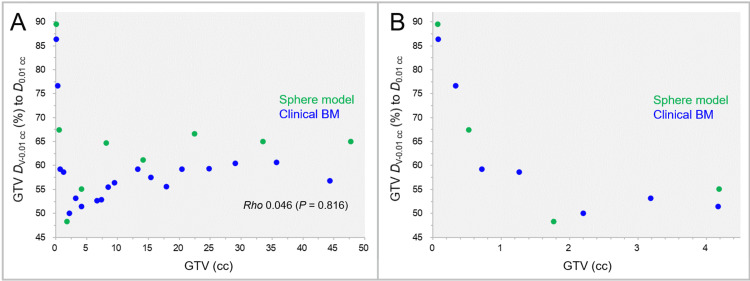
Figure 6. GTV near-minimum dose relative to GTV near-maximum dose as a function of GTV.
The scatter plots show the correlations of the GTVs and the near-minimum doses of the GTVs, DV-0.01 cc (%), relative to the near-maximum doses of the GTVs, D0.01 cc (A, B). The GTVs are limited to ≤4.5 cc in B. The result of SRCC is added in A.
GTV: gross tumor volume; DV-0.01 cc: a minimum dose to cover a target volume (TV) minus 0.01 cc (D>95% for TV >0.20 cc, D95% for TV ≤0.20 cc); D0.01 cc: a minimum dose covering 0.01 cc of a TV (D0.01 cc for TV ≥0.20 cc and D5% (D<0.01 cc) for TV <0.20 cc); BM: brain metastasis; SRCC: Spearman’s rank correlation coefficient.

