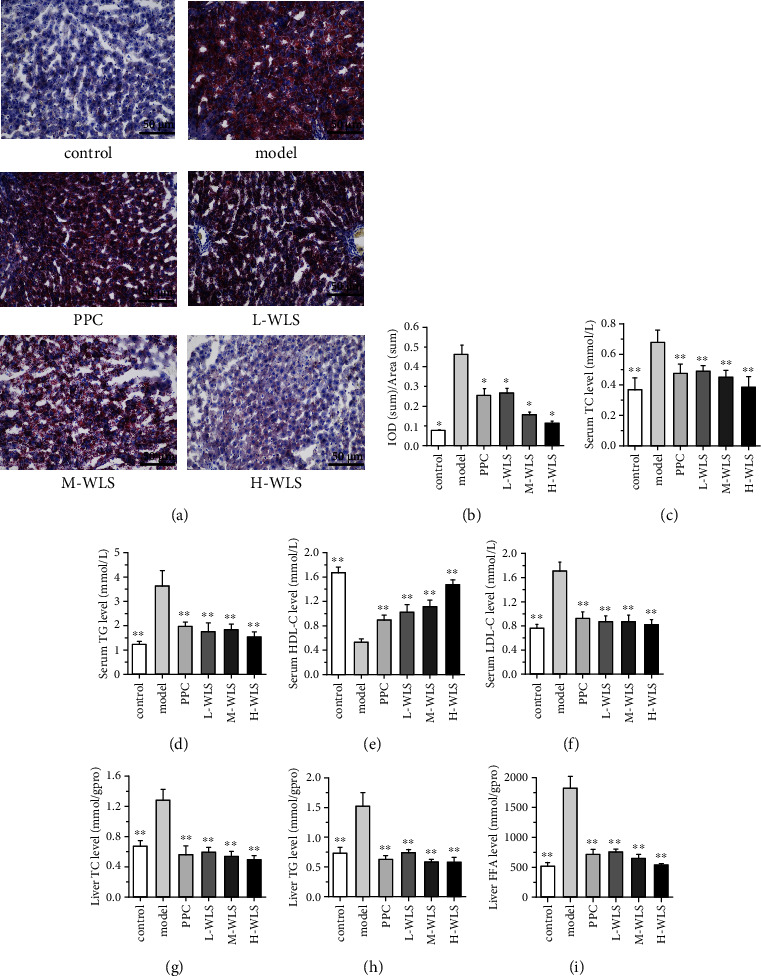
Figure 3.

Effect of WLS on lipid metabolism in MAFLD rats. (a) Oil red O staining of liver tissue (×200). (b) Quantification of oil red O positive area. (c–f) The levels of TC, TG, LDL-C, and HDL-C in serum. (g–i) The levels of TC, TG, and FFA in the liver. Results were expressed as the mean ± SD, n = 3 in a–b, n = 10 in (c–i). ∗P < 0.05, ∗∗P < 0.01, compared with the model group.
