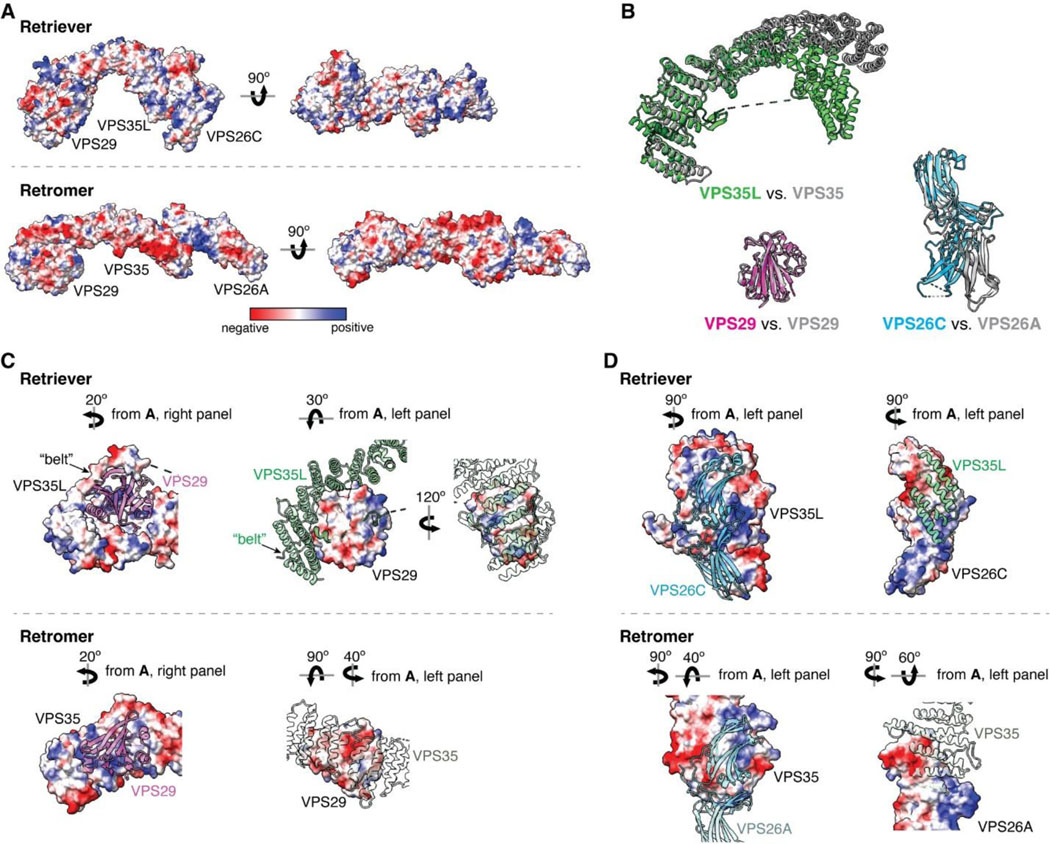
Extended Data Fig. 2. Structural comparison between Retriever and Retromer.
(A) Surface representation of electrostatic potentials of Retriever vs. Retromer (PDB: 7U6F). (B) Superimpose of individual subunits from Retriever (colored) vs. Retromer (gray). (C) Intermolecular interface between VPS35L and VPS29 vs. VPS35 and VPS29, shown as surface representations of electrostatic potentials. (D) same as in (C), with VPS35L and VPS26C vs. VPS35 and VPS26A.

