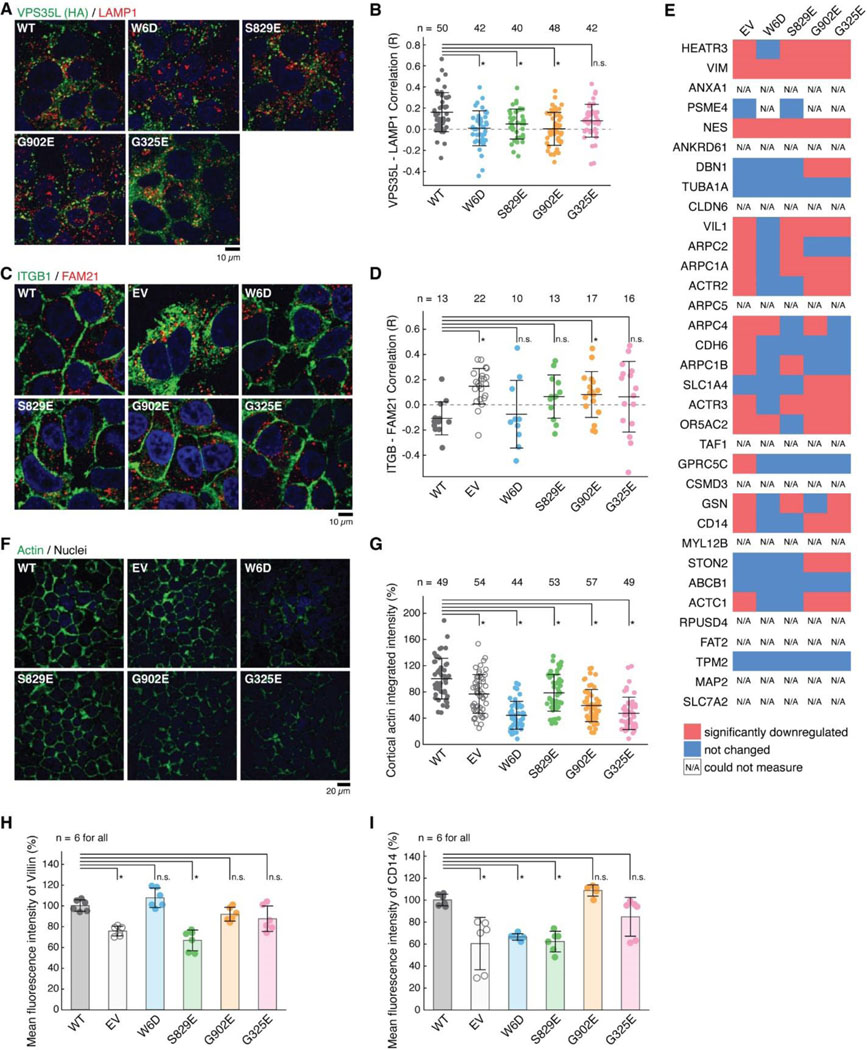
Fig. 4. Disruption of Retriever assembly affects membrane protein homeostasis.
(A) Immunofluorescence staining for VPS35L (green channel, using HA antibody), LAMP1 (red channel), and nuclei (DAPI, blue channel) in the indicated stable Huh-7 cell lines. (B) Quantification of the correlation coefficient for VPS35L and LAMP1 localization for the images shown in (A). Each dot represents an individual cell. (C) Immunofluorescence staining for ITGB1 (green channel), FAM21 (red channel), and nuclei (DAPI, blue channel) in the indicated stable Huh-7 cell lines. (D) Quantification of the correlation coefficient for ITGB1 and FAM21 localization for the images shown in (C). Each dot represents an individual cell. (E) Surface biotinylation and protein isolation, followed by proteomic quantification was performed and protein abundance was compared against VPS35L WT in the indicated cell lines stable Huh-7 cell lines. Red indicates values for proteins with at least 50% reduction compared to VPS35L WT cells, blue represents values that were not significantly reduced, while N/A represents proteins that could not be quantified. (F) Phalloidin staining for F-Actin (green channel) and nuclei (DAPI, blue channel) in the indicated stable Huh-7 cell lines. (G) Quantification of the cortical actin staining in the images shown in (F). Each dot represents an individual cell. (H-I) Quantification of Villin (H) and CD14 (I) fluorescence staining intensity as determined by FACS, expressed as % compared to VPS35L WT cells.

